Run CI/CD on Cloudflare Workflows: deploy in 18 lines, 33 free runs
Run CI/CD on Cloudflare Workflows and a GitHub Actions YAML becomes 18 lines of TypeScript. Which meter bills first, and what private beta still blocks.

TL;DR
To run CI/CD on Cloudflare Workflows you stop writing a configuration file and start writing a program: a forty-line GitHub Actions YAML collapses into 18 lines of TypeScript where Promise.all() replaces the needs: graph. The orchestration is effectively free — 500,000 Workflow steps are included on Workers Paid, about 83,000 six-step runs — but the container memory underneath exhausts after roughly 33 runs a month, and that is the number that decides your bill. The trigger, Artifacts, is still private beta, so today you start the Workflow from a webhook instead.
What is CI/CD on Cloudflare Workflows?
CI/CD on Cloudflare Workflows is a pipeline defined as TypeScript code rather than YAML, where each build step is a durable Workflow step executing a shell command inside an isolated Cloudflare sandbox, and step ordering comes from the language’s own await rather than a needs: key.
Cloudflare’s framing is the whole idea in one line: “A CI/CD pipeline is just a Workflow.”
That is a stronger claim than it looks. A CI pipeline is a durable, retryable, observable dependency graph of shell commands run in isolated environments. Cloudflare Workflows is a durable, retryable, observable execution engine for dependency graphs of arbitrary steps. The CI SDK — the @cloudflare/ci npm package — is the thin part that maps one onto the other, using the Sandbox SDK for isolation and R2 for the dependency cache.
So the interesting question is not “can this run my tests.” It is: what changes when your pipeline stops being a configuration file and becomes a program?
The 18 lines
Here is a complete lint/test/typecheck/build/deploy pipeline, as published by Cloudflare:
const deps: CiRunnerResult = await ci.runner({
  name: 'install',
  command: 'bun install --frozen-lockfile',
  cache: { inputs: ['package.json', 'bun.lock'] },
});

await Promise.all([
  deps.runner({ name: 'lint', command: 'bun run lint' }),
  deps.runner({ name: 'test', command: 'bun run test' }),
  deps.runner({ name: 'typecheck', command: 'bun run typecheck' }),
  deps.runner({ name: 'build', command: 'bun run build' }),
]);

await deps.runner({
  name: 'deploy',
  command: 'bun wrangler deploy',
  cloudflareCredentials: {
    accountId: this.env.CLOUDFLARE_DEPLOY_ACCOUNT_ID,
  },
});
Three things are doing the work, and none of them is syntax sugar.
cache: { inputs: [...] } snapshots the sandbox after install. Every deps.runner(...) below starts from that snapshot, so the four parallel checks do not each reinstall — the single most common source of wasted minutes in a hand-rolled Actions workflow.
Promise.all() is the dependency graph. Cloudflare’s documentation is explicit that this is the default, not the optimization: “By default, each step in a Workflow starts independently, meaning the steps will execute concurrently unless otherwise specified.” You do not opt into parallelism, you opt into serialization by awaiting. That inverts the Actions default, where a job runs alone unless you deliberately fan it out.
await before the deploy step is the join. There is no needs: [lint, test, typecheck, build] key because the language already has one.
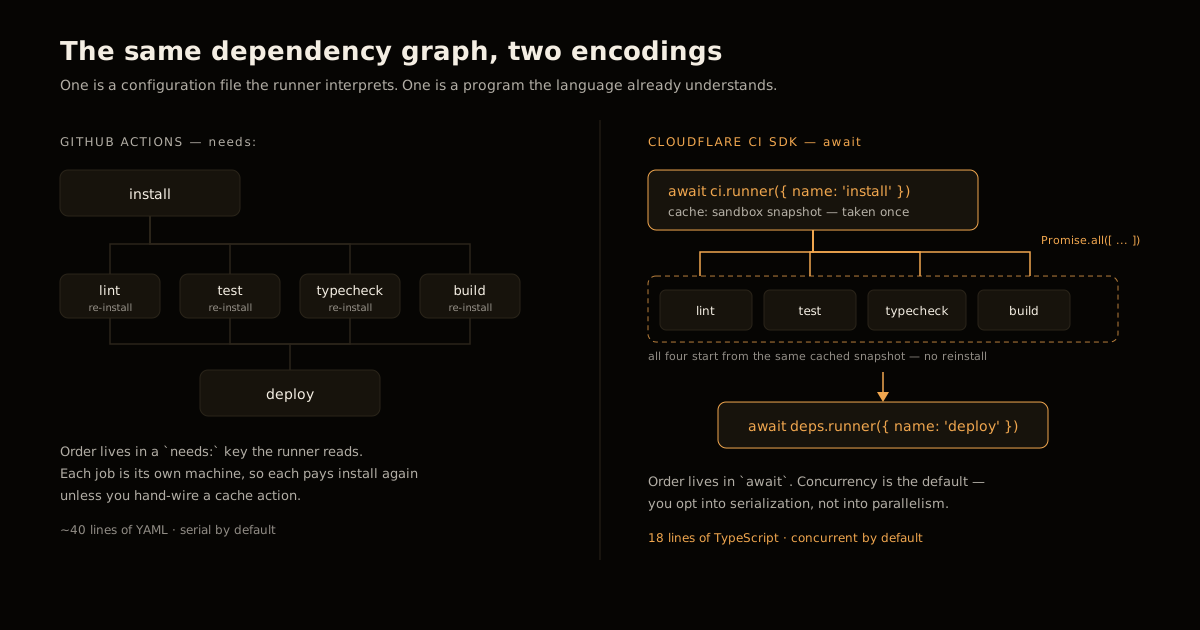
If you have built an agent scheduler you have seen this shape before — it is the same move as replacing a sequential agent loop with a DAG. The graph becomes the data structure you can validate, schedule, and cost before anything runs.
How to run CI/CD on Cloudflare Workflows today
Be clear about what ships today, because the announcement blurs it.
The intended trigger is an event on Cloudflare’s code storage, wired in wrangler.jsonc:
{
  "triggers": {
    "events": [
      {
        "type": "cf.artifacts.repo.pushed",
        "filter": { "namespace": "CI", "repoName": "my-repo" },
        "target": { "type": "workflow", "workflow_name": "ci-workflow" }
      }
    ]
  }
}
That depends on Artifacts, which Cloudflare describes as something you “request to join the private beta” for. Workflows and the Sandbox SDK are both generally available on Workers Paid; Artifacts is not.
The practical consequence is small and worth stating plainly: build the Workflow now, start instances from a GitHub webhook hitting a Worker, and replace the entry point with the events block when your beta access lands. Nothing in the 18 lines above changes. If you have already deployed anything on Workers, you have written that webhook Worker before.
What it costs, and which meter bills first
This is the part nobody publishes, so here is the arithmetic with the assumptions on the table.
Model one run as: install for 60s, four checks at 90s each in parallel, deploy for 30s. That is 450 container-seconds and six Workflow steps. Run it on a standard-2 container — 1 vCPU, 6 GiB memory, 12 GB disk.
At the published Containers rates of $0.0000025 per GiB-second, $0.000020 per vCPU-second and $0.00000007 per GB-second:
| Resource | Per run | Rate | Cost |
|---|---|---|---|
| Memory | 2,700 GiB-s | $0.0000025 | $0.00675 |
| vCPU | 450 vCPU-s | $0.000020 | $0.00900 |
| Disk | 5,400 GB-s | $0.00000007 | $0.00038 |
| Workflow steps | 6 | included | $0 |
| Total | $0.0161 |
The same six-job shape on GitHub Actions bills roughly 10 minutes of Linux 2-core time at $0.006 per minute — about $0.060, because Actions rounds each job up to the whole minute and Cloudflare bills the seconds you used. Call it 3.7× cheaper on this workload, and treat that multiple as a shape, not a promise: your numbers move with your instance type and your test suite’s actual runtime.
The more useful finding is which included allowance runs out first. Workers Paid includes 25 GiB-hours of memory, 375 vCPU-minutes, 200 GB-hours of disk, and 500,000 Workflow steps per month. Divide each by what one run consumes:
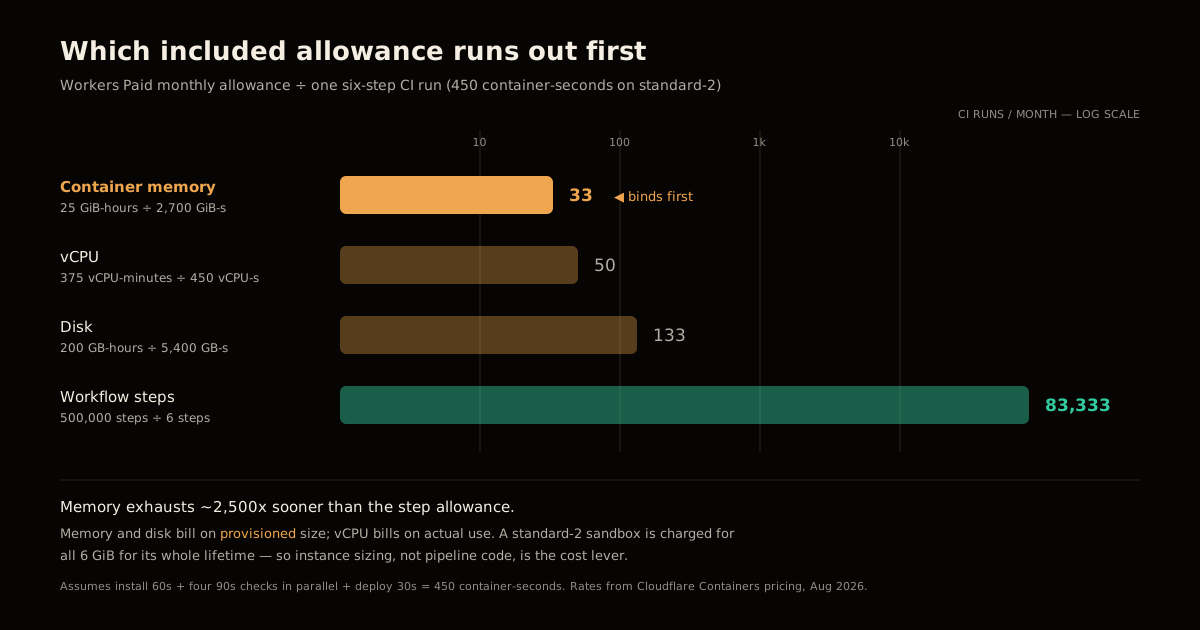
Memory binds, by three orders of magnitude. The reason is a billing asymmetry that is easy to miss: vCPU is charged on actual use, but memory and disk are charged on provisioned size. A standard-2 sandbox bills all 6 GiB for its whole lifetime whether your linter touches 200 MB or 5 GB.
Which turns the sizing decision into the cost decision. Dropping the checks to basic (1/4 vCPU, 1 GiB) cuts memory billing 6×. That is the lever — not the pipeline code, not the step count. The same instinct that makes Docker Swarm beat Kubernetes on a $166/month line applies here: the platform is rarely the expensive part, the provisioned envelope is.
The ceilings that decide whether this scales
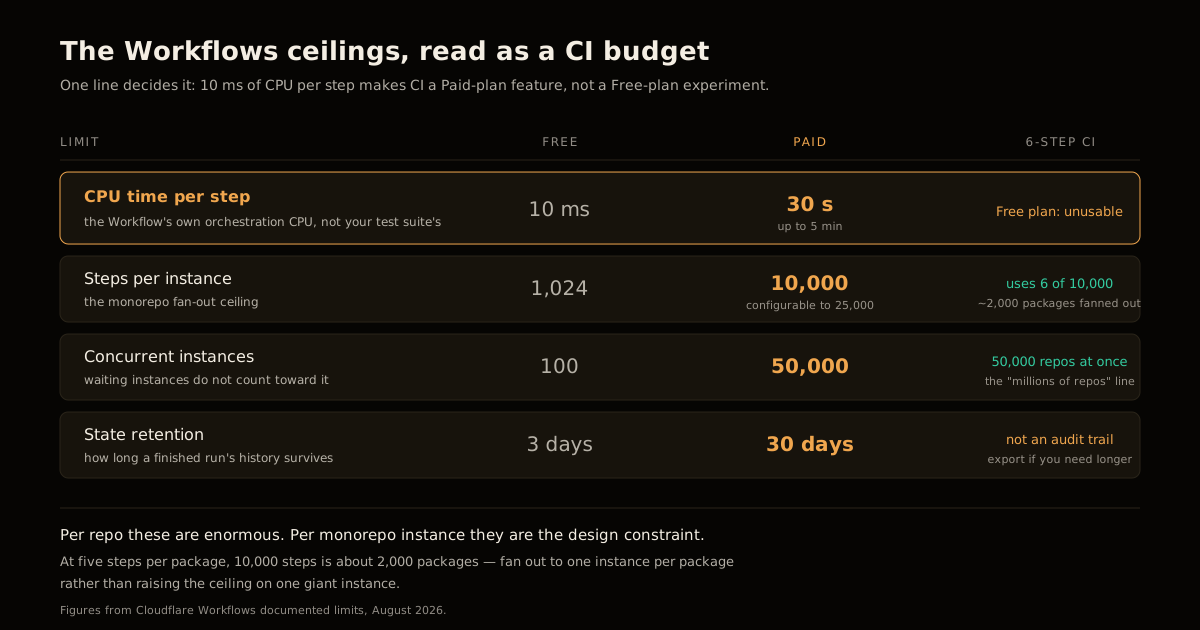
Workflows has hard documented limits, and the Free/Paid split is severe enough that CI is a Paid-plan feature in practice:
Read those against a CI workload:
- 10 ms of CPU per step on Free ends the conversation. Paid gives 30 seconds by default, configurable to 5 minutes. Note this is the Workflow’s own CPU, not your test suite’s — the tests run in the container — but orchestration logic that parses output or diffs a lockfile lives inside that budget.
- 50,000 concurrent instances on Paid is the number that justifies the “millions of repos” headline. Waiting instances do not count toward it.
- 10,000 steps per instance is generous per repo and a genuine ceiling for a monorepo fan-out: at five steps per package you hit it around 2,000 packages. Fan out to one instance per package instead of one giant instance.
- 30-day state retention on Paid means your run history is 30 days, not forever. If you need audit trails beyond that, export them.
The self-healing step, and the one detail worth copying
The announcement’s headline feature is a HealingAgent — a Durable Object backed by Workers AI (the example configures @cf/moonshotai/kimi-k2.7-code) that catches a failure, attempts a fix, and reports back:
} catch (failure) {
  if (!isCiRunnerFailure(failure)) throw failure;
  const healed = await step.do('heal', { retries: { limit: 0, delay: 0 }, timeout: '5 hours' },
    async () => {
      const healer = await getAgentByName(this.env.HEALER, event.instanceId);
      using result = await healer.heal({ failure: enrichFailure({ failure, event, baseBranch }),
        prompt: 'Fix every observed failure without weakening validation.' });
      return { branch: result.branch, commit: result.commit, steps: result.steps };
    });
  throw new CiRunFailedWithFix(failure, healed);
}
I am skeptical of auto-fixing CI in general — most red builds are red for a reason, and an agent optimizing for green has an obvious shortcut available. But look at the last line. The run still throws. The fix lands on a separate branch and a human decides. The prompt even preempts the shortcut: “without weakening validation.”
That is the correct default and it generalizes past Cloudflare. An agent that proposes a fix is a colleague; an agent that can turn a red build green in place is a way to ship broken code with a passing badge. It is the same vibe-to-production gap every agent deployment runs into — the capability is real, the guardrail is what makes it usable.
Also note isCiRunnerFailure(failure) rethrows anything that is not a step failure. Without it, an OOM or a binding misconfiguration gets handed to an LLM as if it were a broken test.
Should you move?
| You are | Verdict |
|---|---|
| A platform running CI on customers’ repos | Strongest case. This is what it was built for — define the pipeline once, run it across every tenant, 50,000 concurrent instances. |
| Already deploying to Workers, tired of Actions install times | Worth a spike. The cached-snapshot fan-out is the real win, and the cost math favors you. |
| A team that leans on marketplace actions | Stay. No marketplace, no matrix keyword, no PR status-check integration out of the box. |
| Needing macOS or Windows runners | Not applicable. Containers are Linux. |
| On the Workers Free plan | No. 10 ms of CPU per step is not a CI budget. |
The honest summary: the runtime is genuinely good and the ecosystem is genuinely absent. That is normal for a platform at this stage, and it means the decision turns on whether your pipeline is mostly your commands — in which case there is nothing to port — or mostly someone else’s published actions, in which case there is everything to port. If your suite is already a handful of shell commands wired into a deliberate testing strategy, the port is an afternoon.
Start it as a program, keep the failure throwing, and size the container before you tune anything else.
FAQ
Can I run CI/CD on Cloudflare Workflows today? You can run the pipeline, but not the trigger. Workflows and the Sandbox SDK are both available on the Workers Paid plan, so you can build and execute the step graph right now. What is gated is Artifacts — Cloudflare’s code storage and the source of the cf.artifacts.repo.pushed event — which is in private beta. Until you are admitted, wire a GitHub webhook to a Worker that starts the Workflow instance, and swap the trigger later.
How is this different from just running GitHub Actions? The pipeline is a program, not a configuration file. Dependency order comes from await and Promise.all() instead of a needs: key, so the same TypeScript type checking, loops, and imports you use everywhere else apply to the pipeline. The operational difference is durability: Workflows persists state per step, so a failed step restarts from its own boundary rather than replaying the whole job.
Which meter bills first when running CI on Cloudflare? Container memory, and it is not close. Memory is billed on provisioned GiB-seconds, so a standard-2 instance is charged for all 6 GiB whether your test suite touches them or not, while vCPU is billed on actual use. On the Workers Paid allowances, memory exhausts after roughly 33 runs of a six-step pipeline, vCPU after 50, and disk after 133. The Workflows step allowance is never the constraint.
What is the maximum number of steps in one Cloudflare Workflow? 1,024 steps on the Free plan and 10,000 on Paid, configurable up to 25,000. For a per-repo CI pipeline that is enormous headroom. It becomes a real ceiling only if you fan one Workflow instance out across a monorepo — at five steps per package, 10,000 steps is about 2,000 packages, and the fix is one instance per package rather than a bigger instance.
Does the self-healing agent step commit fixes to my main branch? No. In Cloudflare’s example the HealingAgent pushes its verified fix to a separate branch and the original run still fails, throwing CiRunFailedWithFix. That design choice is the one worth copying regardless of which platform you use: an agent that can repair a red build is useful, an agent that can silently make a red build green is a way to ship broken code with a passing badge.
Is Cloudflare Workflows a full GitHub Actions replacement? Not yet, and the gap is the ecosystem rather than the runtime. There is no marketplace of pre-built actions, no matrix strategy keyword, no pull_request status-check integration out of the box, and macOS or Windows runners do not exist. It is a strong fit for platforms running CI on behalf of many customer repos, and a weak fit for a team that mostly wants someone else’s published action to work.
Sources
- Cloudflare, “Run CI/CD for millions of repos — on your platform, on Cloudflare” — the primary source: the
@cloudflare/ciSDK, theci.runner()/Promise.all()pipeline, thecf.artifacts.repo.pushedtrigger, theHealingAgentexample, and the Artifacts private-beta status. - Cloudflare Developer Docs, Workflows limits — 1,024 vs 10,000 steps per instance, 100 vs 50,000 concurrent instances, 10 ms vs 30 s of CPU per step, and 3 vs 30-day state retention.
- Cloudflare Developer Docs, Containers pricing — the $0.0000025 / GiB-second, $0.000020 / vCPU-second and $0.00000007 / GB-second rates, the included 25 GiB-hours, 375 vCPU-minutes and 200 GB-hours, and the
litethroughstandard-4instance sizes. - Cloudflare Developer Docs, Sandbox SDK —
@cloudflare/sandbox, availability on Workers Paid, and the container-backed isolation model the CI steps run in. - GitHub Docs, Billing for GitHub Actions — the $0.006/minute Linux 2-core rate and the 2,000 / 3,000 / 50,000 included monthly minutes used in the cost comparison.
Related Articles

AI Coding Agents & DX
Rust LLM Policy: Use AI to Review, Not to Create
The Rust LLM policy bans AI-created code and prose but allows AI review, analysis, and bug-finding. Here's the exact rule, why it works, and how to copy it.

AI Coding Agents & DX
Is Claude Code Auto Mode Reliable in Production? A Field Report
I ran Claude Code auto mode in production for a week — where it's reliable, where it broke, real token costs from my usage logs, and my honest verdict.

AI Coding Agents & DX
Claude Code vs Cursor for Production: A Shipping Engineer's Field Report (2026)
Claude Code vs Cursor for production, field-tested on real shipping tasks: a working engineer's decision table, failure modes, pricing, and which to use when.
Keep reading
Get new posts on AI, Claude Code & LLMs
New deep-dives on AI engineering, Claude Code, and developer tooling — follow along however you prefer.
About the Author

Software engineer writing about AI, Claude Code, LLMs, OpenAI, Anthropic, and developer tooling. 5+ years building production systems at Expedia Group, Tekion, and BYJU'S.