Fix slow LLM inference in macOS VMs: 12.6 → 207 tok/s
LLM inference in macOS VMs collapses to 12.63 tok/s because the guest reports GPU family 5 and llama.cpp drops its matrix kernels. The check, and its limits.

TL;DR
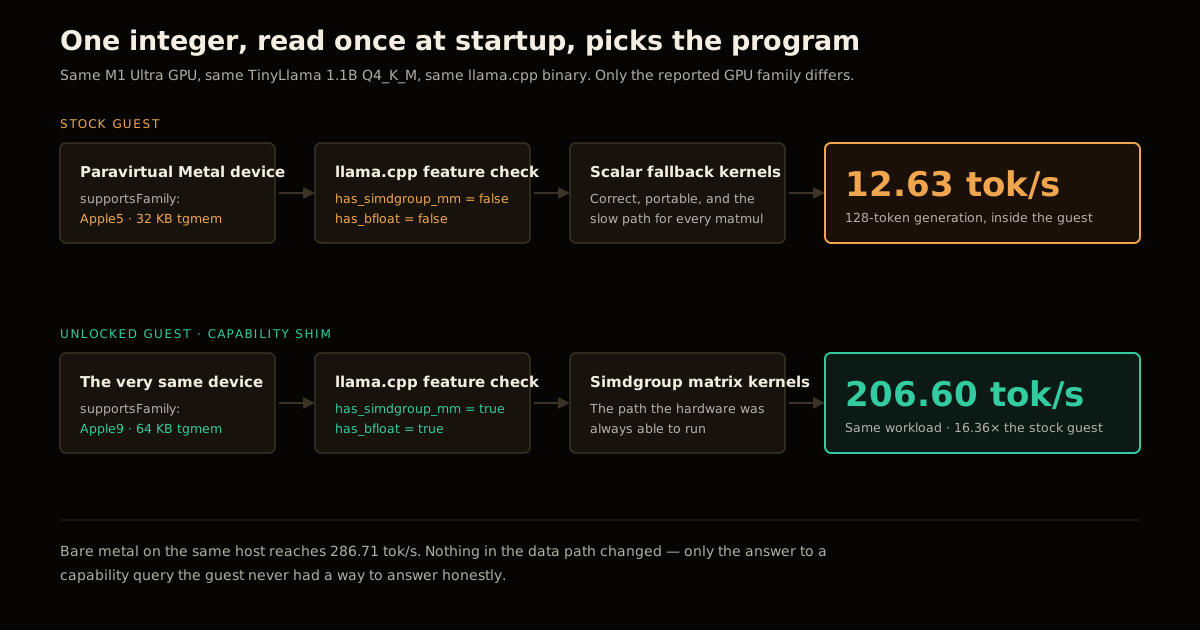
The bottleneck in LLM inference in macOS VMs is a capability string, not the hypervisor: the guest reports its GPU as Apple family 5, and llama.cpp reads that number at startup and compiles its scalar fallback kernels instead of the simdgroup matrix ones. On an M1 Ultra that turns 286.71 tok/s of bare-metal TinyLlama generation into 12.63 tok/s inside the guest. The team at cua shimmed that single query to report family 9 and got 206.60 tok/s back — a 16.36× jump with no change to the GPU, the driver, or the model.
What is really slowing LLM inference in macOS VMs
The instinct when a workload is 16× slower in a VM is to blame virtualization overhead: memory bandwidth, scheduling, device emulation. That instinct is wrong here, and the way you can tell is that the fix touches nothing in the data path.
Apple’s Virtualization.framework hands a guest a paravirtualized graphics device. That device is real — it executes Metal shaders on the host’s actual GPU — but it advertises a conservative feature level. On cua’s M1 Ultra host, the guest device reported supportsFamily:MTLGPUFamilyApple5 and a maximum threadgroup memory of 32 KB. The host GPU underneath is a 48-core M1 Ultra that supports family 9 and 64 KB.
Nothing is broken at that point. The GPU still works. What breaks is every runtime that asks the device what it can do and then picks its code path from the answer.
The four lines of llama.cpp that decide your throughput
llama.cpp’s Metal backend does its feature detection once, at device init, in ggml-metal-device.m:
dev->props.has_simdgroup_reduction  = [dev->mtl_device supportsFamily:MTLGPUFamilyApple7];
dev->props.has_simdgroup_reduction |= [dev->mtl_device supportsFamily:MTLGPUFamilyMetal3_GGML];

dev->props.has_simdgroup_mm = [dev->mtl_device supportsFamily:MTLGPUFamilyApple7];

dev->props.has_bfloat  = [dev->mtl_device supportsFamily:MTLGPUFamilyMetal3_GGML];
dev->props.has_bfloat |= [dev->mtl_device supportsFamily:MTLGPUFamilyApple6];
Apple5 is below Apple7 and below Apple6, and the paravirtualized device does not claim Metal 3 either. So all three flags come back false in one shot. has_simdgroup_mm is the expensive one: it gates the matrix-multiply kernels that do essentially all the arithmetic in a transformer forward pass. Without it, llama.cpp runs the scalar fallback path — correct, portable, and drastically slower.
This is the useful mental model: the guest is not slow, it is downgraded. A single integer comparison, evaluated once at startup, selects a different program.
What the numbers actually say
cua benchmarked a Tahoe Cua guest (macOS 26.5.2, 8 vCPU, 16 GiB RAM, Lume 0.5.1) against bare metal on an M1 Ultra host running macOS 26.6.1.
TinyLlama 1.1B Chat Q4_K_M
| Metric | Bare metal | Stock guest | Unlocked guest | Speedup |
|---|---|---|---|---|
| Prompt, 512 tokens | 4,871.99 tok/s | 431.86 tok/s | 4,786.70 tok/s | 11.08× |
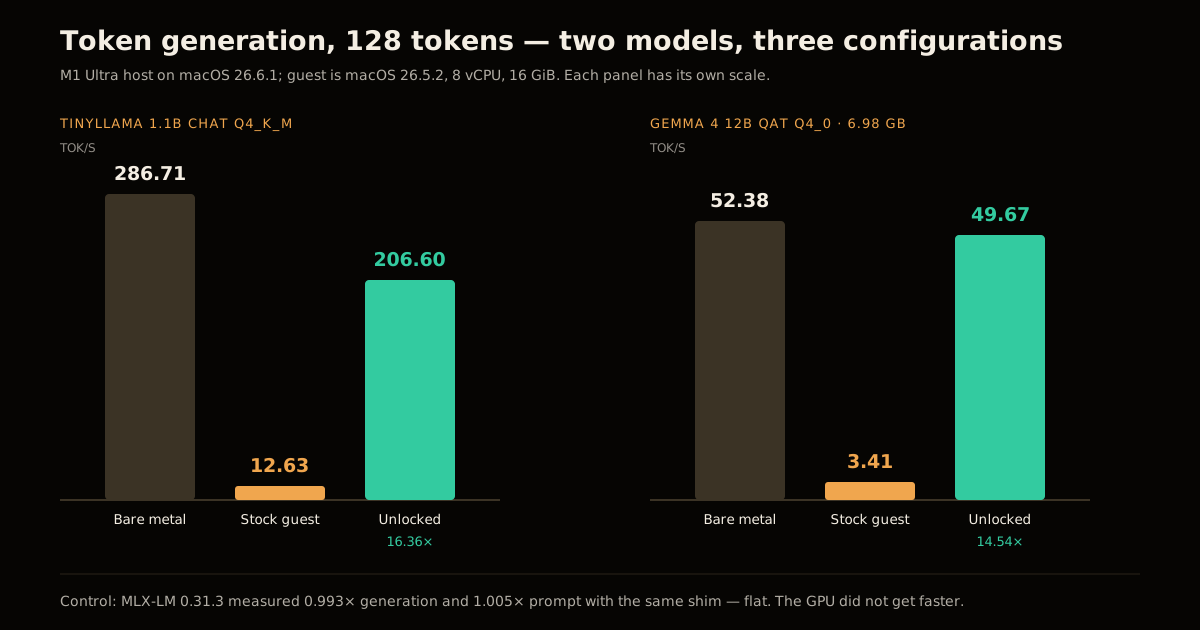
| Generation, 128 tokens | 286.71 tok/s | 12.63 tok/s | 206.60 tok/s | 16.36× |
Gemma 4 12B QAT Q4_0 (6.98 GB)
| Metric | Bare metal | Stock guest | Unlocked guest | Speedup |
|---|---|---|---|---|
| Prompt, 512 tokens | 517.88 tok/s | 71.66 tok/s | 515.76 tok/s | 7.20× |
| Generation, 128 tokens | 52.38 tok/s | 3.41 tok/s | 49.67 tok/s | 14.54× |
Read the stock-guest column first, because that is the number most people are actually living with. A 12B model generating 3.41 tok/s is not a slow model — it is unusable. Anyone who tried local inference in a macOS VM, saw that, and concluded “VMs can’t do GPU work” reached a reasonable conclusion from a misleading measurement.
The control in this experiment is the one that makes it credible. cua also ran MLX-LM 0.31.3 with Llama-3.2-3B-Instruct-4bit and got 1.005× on prompt processing and 0.993× on generation — flat, inside noise. The shim did not make the GPU faster. It made one runtime stop disqualifying itself.
The fix, and exactly how sketchy it is
Two pieces. A system-level default that stops the paravirtualized graphics stack from clamping the feature level:
defaults write com.apple.gpusw.ParavirtualizedGraphics
  ForceUnrestrictedDeviceFeatureLevel -bool true
And a per-process shim, injected into the workload, that intercepts the capability query and answers differently:
DYLD_INSERT_LIBRARIES=/path/to/LumeMetalCapabilities-arm64.dylib
LUME_METAL_APPLE_FAMILY_MAX=1009
  llama-cli -m model.gguf ...
What changes, per cua’s own table: supportsFamily:1009 flips false → true, simdgroup matrix and simdgroup reduction turn on, bfloat16 turns on, and maximum threadgroup memory goes from 32 KB to 64 KB.
Now the honest part, because this is the section that decides whether you should touch it:
- It relies on private Metal implementation details. Nothing here is API. A point release can move it.
- It is process-scoped. The shim affects the injected process and its children, not the guest.
DYLD_INSERT_LIBRARIESis refused by hardened and platform-protected binaries. If your inference server ships signed with hardened runtime, injection simply will not happen.- Validation is narrow. One M1 Ultra host, one guest image, one virtualization stack. There is no claim that this generalizes to M3/M4 hosts or to other guest OS builds.
- The remaining virtualization overhead does not go away. The best case is still below bare metal.
cua labels the work experimental and version-sensitive, and that label is doing real work. The value of this result for most people is not the dylib — it is knowing that the bottleneck is a capability string, which means it is diagnosable in thirty seconds and fixable upstream rather than mysterious.
How to tell in thirty seconds whether you’re hit
Run llama.cpp in the guest and read its Metal init lines:
ggml_metal_device_init: simdgroup reduction   = false
ggml_metal_device_init: simdgroup matrix mul. = false
ggml_metal_device_init: has bfloat            = false
Three false values on Apple Silicon means you are running the fallback kernels. On the host, the same binary prints true for all three. That one-line diff is the whole diagnosis, and it costs you a single process start — far cheaper than the throughput benchmarking most people reach for first. It is the same discipline as reading the flags before tuning anything in vLLM’s throughput knobs: find out what the runtime decided about your hardware before you start tuning around it.
The residual gap tells you which workloads survive
Restoring the matrix kernels does not restore everything, and where it falls short is informative:
| Model | Prompt recovered | Generation recovered |
|---|---|---|
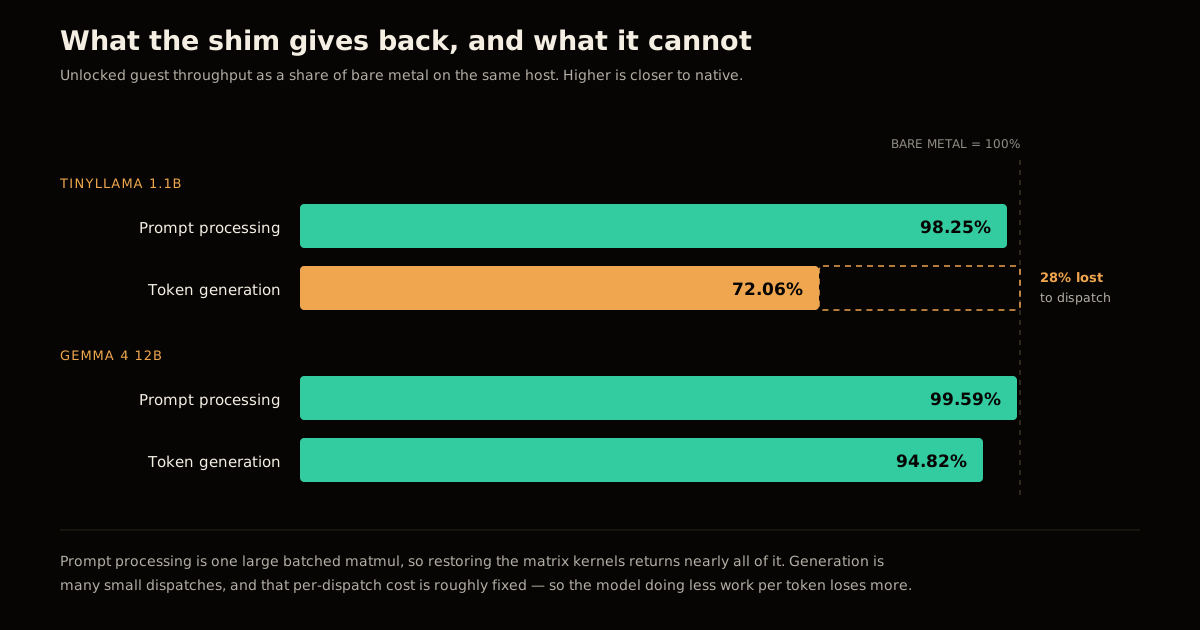
| TinyLlama 1.1B | 98.25% | 72.06% |
| Gemma 4 12B | 99.59% | 94.82% |
Prompt processing comes back almost completely on both — it is one large batched matmul, exactly what the simdgroup kernels exist for. Generation is many small sequential dispatches, and the per-dispatch overhead of the virtualized path is the part the shim cannot touch.
That overhead is roughly fixed per token, so it hurts in inverse proportion to how much work each token does. The 1.1B model, where each step is cheap, loses 28%. The 12B model, where each step is expensive enough to amortize the dispatch, loses 5%. In a VM, bigger models pay a smaller relative virtualization tax — the opposite of the intuition that heavy models suffer most.
Who should actually care
If you can run inference on the host, run it on the host. The VM buys isolation, not speed.
But a lot of current agent infrastructure needs that isolation and has no alternative. Computer-use agents drive a real desktop, and you do not want that desktop to be yours. Untrusted-code execution wants a disposable machine — the same reasoning behind sandboxing an agent’s internet access. macOS CI runners are virtualized because Apple’s licensing requires Apple hardware and nobody wants one job’s state leaking into the next. In all three cases you may want a model resident in the guest, and 3.41 tok/s decides that for you.
The transferable lesson is broader than macOS. Any time you move a GPU workload into a virtualized or containerized environment, the runtime re-negotiates capabilities with whatever device it is shown, and a conservative answer silently selects a slower program. The same class of bug shows up when you run a large model on constrained hardware or set up a local coding model and the throughput lands nowhere near what the hardware should do. Check what the runtime thinks it is talking to before you accept the number.
Common mistakes
- Benchmarking the VM against the host and concluding “virtualization is slow.” You have measured a capability downgrade, not overhead. The two have completely different fixes.
- Reaching for quantization first. A smaller quant will not restore the matrix kernels; it just makes the wrong kernels run on less data.
- Assuming the shim helps every runtime. MLX-LM saw 0.993×. If your stack does not branch on
supportsFamilyin its hot path, there is nothing to unlock. - Shipping
DYLD_INSERT_LIBRARIESto production. Injection into a hardened binary fails, and a private-detail dependency will break on a macOS point release with no deprecation warning.
The takeaway
Feature detection is a code-path selector, and in a virtualized environment it is being answered by something that is guessing conservatively on your behalf. cua’s result is worth reading not because a dylib made a VM 16× faster, but because it localizes a large, widely-accepted performance loss to a single integer that a paravirtualized device reported at startup. Read your runtime’s capability log before you benchmark anything. If it says false where the host says true, no amount of tuning downstream will recover what that line already gave away.
FAQ
Why is LLM inference in macOS VMs so much slower than on the host?
It is usually not raw virtualization overhead — it is capability negotiation. Apple’s Virtualization.framework exposes a paravirtualized Metal device that reports a conservative GPU family, and llama.cpp reads that family at startup to decide which kernels to compile. Reported as Apple family 5, the device fails the MTLGPUFamilyApple7 check that gates simdgroup matrix multiply, so the runtime silently falls back to scalar paths that are an order of magnitude slower.
How do I check whether my VM is hitting this?
Start llama.cpp inside the guest and read the first few lines of its Metal init log. If simdgroup reduction, simdgroup matrix mul. and has bfloat all print false on Apple Silicon, the guest is being handed a downgraded device profile. Run the same binary on the host and compare — on bare metal all three print true, and that difference alone accounts for most of the throughput gap.
Is the capability shim safe to run in production?
No, and cua does not claim otherwise. It depends on private Metal implementation details, it is injected with DYLD_INSERT_LIBRARIES so hardened or platform-protected binaries will reject it outright, and the published validation covers exactly one host configuration — an M1 Ultra running macOS 26.6.1. Treat it as a research result that tells you where the cost is coming from, not as a deployment recipe.
Does this affect MLX too, or only llama.cpp?
In cua’s tests MLX-LM was flat: 1.005× on prompt processing and 0.993× on generation, meaning the shim changed nothing. That is the useful control in the experiment — it shows the speedup is not the shim making the GPU faster, but llama.cpp being un-downgraded. Runtimes that do not branch on supportsFamily for their hot kernels have nothing to gain here.
Why does the fix recover prompt processing better than token generation?
Prompt processing is one big batched matrix multiply, so restoring the simdgroup matrix kernels returns almost all of it — 98.25% of bare metal on TinyLlama and 99.59% on Gemma 4 12B. Generation is many tiny sequential dispatches, and the per-dispatch cost of the virtualized GPU path stays. That residual hits small models hardest: TinyLlama recovered only 72.06% of bare-metal generation while the 12B model recovered 94.82%.
Should I just run inference on the host instead?
If you can, yes — the VM buys you isolation, not speed, and the best case here is still short of bare metal. The reason to care is that a lot of agent infrastructure genuinely needs the isolation: computer-use agents, untrusted-code sandboxes, and macOS CI runners all want a disposable guest. This work matters because it turns “VMs are hopeless for inference” into a specific, diagnosable capability bug.
Sources
- GPU passthrough for macOS VMs: 11-16× faster LLM inference — cua, benchmarks and the capability shim
ggml-metal-device.m— llama.cpp’s Metal capability detectionMTLGPUFamily— Apple’s GPU family constants and what each level implies
Frequently asked questions
Google Search · Preferred sources
Prefer this site on Google
If you already read this writing, add umesh-malik.com as a Preferred Source. Google can then highlight it with a preferred badge in Top Stories, AI Overviews, and AI Mode — for you, not as a site-wide ranking boost.
Related Articles

LLM Engineering
Run Kimi K3 Locally: 2.8T Params From 4 SSDs at 1 Tok/s
Run Kimi K3 locally on a MacBook by streaming 1.45TB of experts from four SSDs — the 1 tok/s number, and why doubling drives doesn't double speed.

LLM Engineering
Qwen3.8 27B VRAM: how to fit 262K context in 16 GiB, not 64
Qwen3.8 27B VRAM math: 25.9 GiB of FP8 weights plus 16 GiB of KV cache at 262,144 tokens, not 64. The arithmetic, and where a 48 GB card breaks.

LLM Engineering
vLLM throughput tuning: configure these four flags, not a bigger GPU
vLLM throughput tuning starts with KV cache blocks, not a bigger GPU. The four flags that decide your tokens/sec, and the one that quietly backfires.
Keep reading
Get new posts on AI, Claude Code & LLMs
New deep-dives on AI engineering, Claude Code, and developer tooling — follow along however you prefer.
About the Author

Software engineer writing about AI, Claude Code, LLMs, OpenAI, Anthropic, and developer tooling. 5+ years building production systems at Expedia Group, Tekion, and BYJU'S.