vLLM throughput tuning: configure these four flags, not a bigger GPU
vLLM throughput tuning starts with KV cache blocks, not a bigger GPU. The four flags that decide your tokens/sec, and the one that quietly backfires.

TL;DR
vLLM throughput tuning is a memory problem, not a compute one: tokens/sec is set by how much KV cache fits in VRAM, not by how fast the GPU multiplies matrices. Four flags control it — --gpu-memory-utilization, --max-num-batched-tokens, --max-num-seqs and --enforce-eager — and three ship with defaults that are safe rather than optimal. Do the block math once, then tune those four.
What is vLLM throughput tuning?
vLLM throughput tuning is the work of sizing a single number — how many tokens of KV cache your GPU can hold — and then setting the flags that spend it. The GPU is rarely the bottleneck during decode. What runs out is space to store attention keys and values for the sequences you are trying to serve concurrently.
vLLM manages that space as paged blocks, the same way an OS manages virtual memory. From Aleksa Gordić’s teardown of the vLLM internals, the size of one block for a standard transformer layer is:
2 (key/value) * block_size * num_kv_heads * head_size * dtype_num_byteswith block_size defaulting to 16 tokens. Multiply across layers and you get the only number that matters for capacity planning: bytes of KV cache per token of context.
A request is admitted to the running batch only if free blocks exist for it. When the pool empties, the scheduler preempts. That is the whole story — batch width, and therefore throughput, is KV cache bytes ÷ bytes per token ÷ average context length.
Do the block math once
Take Llama 3.1 8B in bf16: 32 layers, 8 KV heads (grouped-query attention), head size 128, 2 bytes per value.
2 × 32 layers × 8 kv_heads × 128 head_size × 2 bytes = 131,072 bytes = 128 KiB per tokenOne 16-token block is exactly 2 MiB. Now budget an 80 GB H100 (~79.6 GiB usable):
| Setting | VRAM budget | Weights | Overhead | KV cache | Tokens cached | Concurrent @ 8K ctx |
|---|---|---|---|---|---|---|
--gpu-memory-utilization 0.80 | 63.7 GiB | 15.0 GiB | ~3 GiB | 45.7 GiB | ~374,000 | 45 |
--gpu-memory-utilization 0.92 | 73.2 GiB | 15.0 GiB | ~3 GiB | 55.3 GiB | ~453,000 | 55 |
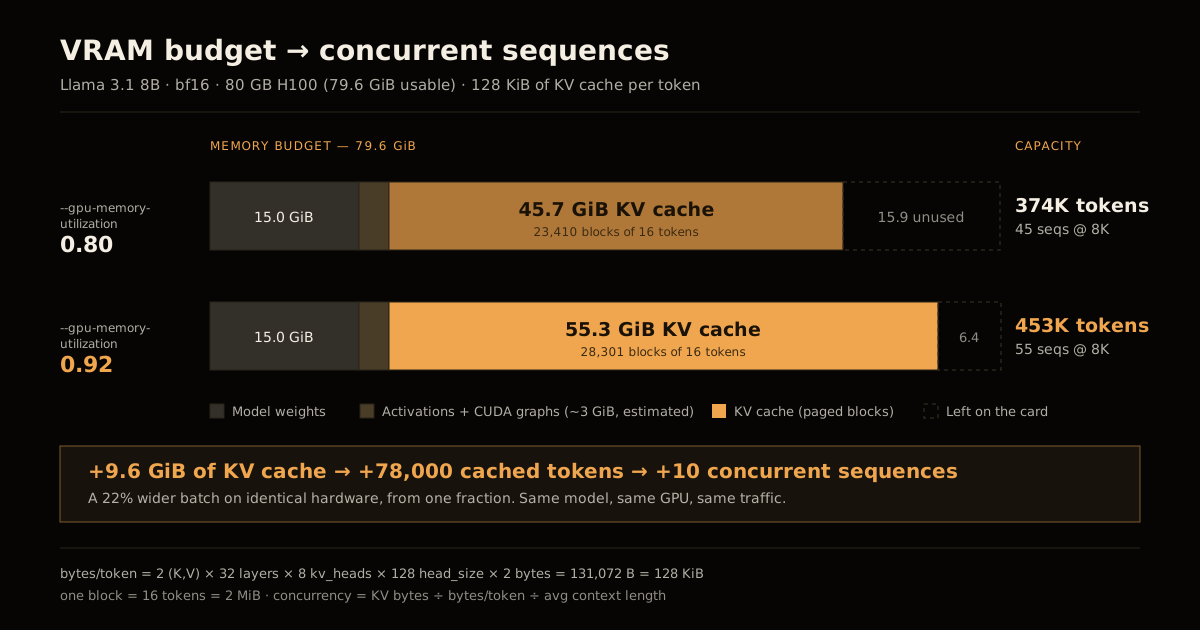
Twelve points of a fraction bought 78,000 tokens of cache and about ten more concurrent sequences — a 22% wider batch on the same hardware, with no change to the model. The overhead figure is an estimate for activations, CUDA graphs and non-Torch allocations; measure yours rather than trusting mine. The rest of the table is arithmetic.
The reason this is worth doing by hand is that the sensitivity is not where people expect. Halving average context length doubles concurrency. Switching from an MHA model to a GQA model with 8 KV heads instead of 32 cuts per-token cost by 4×. Those dominate any flag on this page — but the flags are what you can change this afternoon.
Flag 1 — --gpu-memory-utilization
Default: 0.92. vLLM pre-allocates this fraction of the card for the model executor; whatever is left after weights and overhead becomes the block pool.
Two things trip teams up. First, it is a fraction of total VRAM, not free VRAM — so another process on the card, a second replica, or a display server comes out of the same budget, and you get an out-of-memory crash at startup that looks like a model-size problem. Second, people lower it defensively after one OOM and never raise it back. That defensive 0.80 is the single most common self-inflicted throughput cap I see, and the table above prices it.
Raise it until startup is stable with real headroom, not until it stops crashing. If you need to leave room for a second process, leave it deliberately and write down why.
Flag 2 — --max-num-batched-tokens
This is the per-step token budget, and it is the throughput-versus-latency dial.
In vLLM V1, chunked prefill is enabled by default whenever possible: long prompts are split so a single large prefill cannot monopolise a step. Each step, the scheduler spends its token budget on decode tokens for running sequences first, then fills whatever remains with prefill chunks from waiting ones.
The vLLM optimization guide is direct about the trade: set it above 8192 for throughput, especially for smaller models on large GPUs, and around 2048 when inter-token latency matters more. Bigger budget means prompts get admitted in fewer, fatter chunks and the GPU does more work per launch; smaller budget means the decode stream for already-running requests stays smooth because prefill can never crowd it out.
Pick by workload, not by taste. Batch summarisation wants the big number. An interactive chat UI where users watch tokens appear wants the small one.
Flag 3 — --max-num-seqs
The cap on how many sequences can be in the running batch at once. It is the flag people forget, and it silently overrides all your careful memory work.
If your block math says the cache supports 55 concurrent sequences and --max-num-seqs is set to 32, you are serving 32. The memory you fought for sits unused. Conversely, setting it far above what the cache can hold does not buy concurrency — it buys preemption, which is worse than waiting.
Set it to roughly the concurrency your KV budget actually supports at your real average context length, then watch for preemption in the logs and walk it down if you see it.
Flag 4 — --enforce-eager, the one that backfires
Default: False, which is correct. Passing it skips torch compilation and CUDA graph capture — the docs describe it as “the fastest possible startup, at the cost of steady-state decode performance.”
That trade is exactly backwards for a server. Startup happens once; decode happens billions of times. Without captured graphs, every decode step pays full kernel-launch overhead, and decode is where a serving workload spends essentially all of its wall clock.
--enforce-eager earns its place in a development loop where you restart the engine every two minutes. It reaches production because someone added it to stop waiting on a slow first boot, it worked, and nobody removed it. Grep your deployment manifests for it right now.
How the V1 scheduler spends the budget
The four flags interact through one loop, and seeing it makes the tuning obvious.
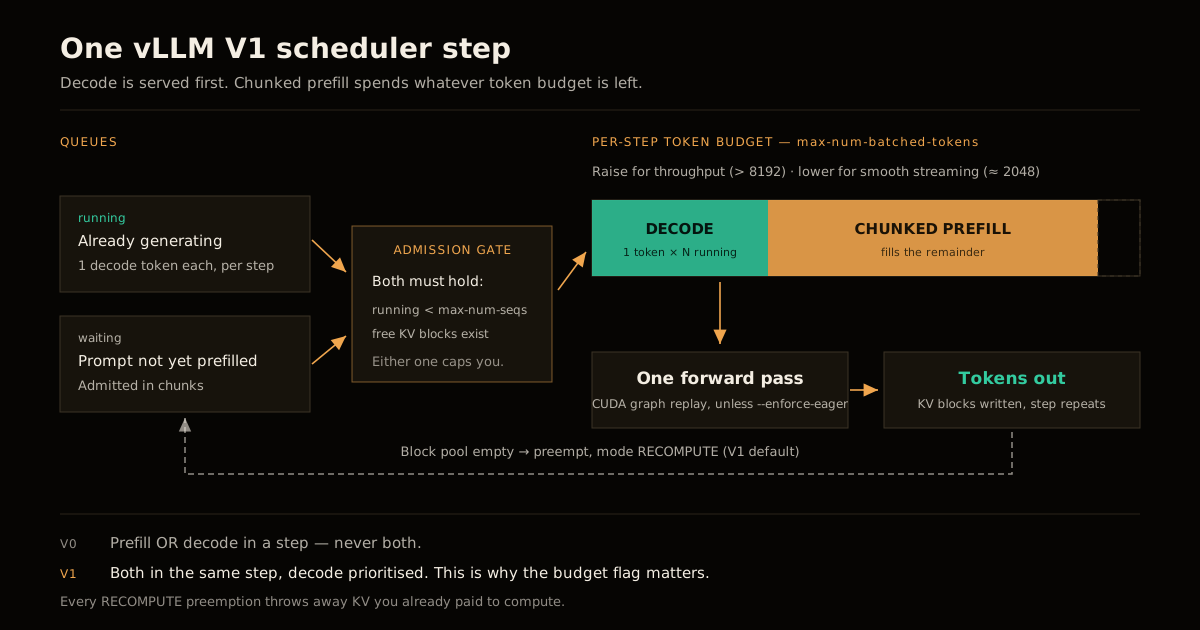
The V1 scheduler prioritises decode — sequences already in the running queue — before pulling prefill work from waiting, and unlike V0 it can mix both in the same step. --max-num-batched-tokens sizes the budget that step spends. --max-num-seqs and the free block count jointly decide who gets admitted. And when the block pool empties, V1’s default preemption mode is RECOMPUTE: the evicted sequence’s cache is thrown away and rebuilt later.
That last detail is why preemption is not a soft degradation. Every preemption is compute you already paid for, deleted. Frequent preemption in the logs means your batch width is written above what your cache can sustain — fix it with --max-num-seqs or more cache, not by hoping.
Prefix caching sits alongside this and is already on (enable_prefix_caching defaults to True). Shared prefixes — a fixed system prompt, a RAG template — are computed once and their blocks reused. You do not enable it; you avoid disabling it, and you put the shared part of your prompt first so there is a prefix to match.
Symptom to flag: what to change first
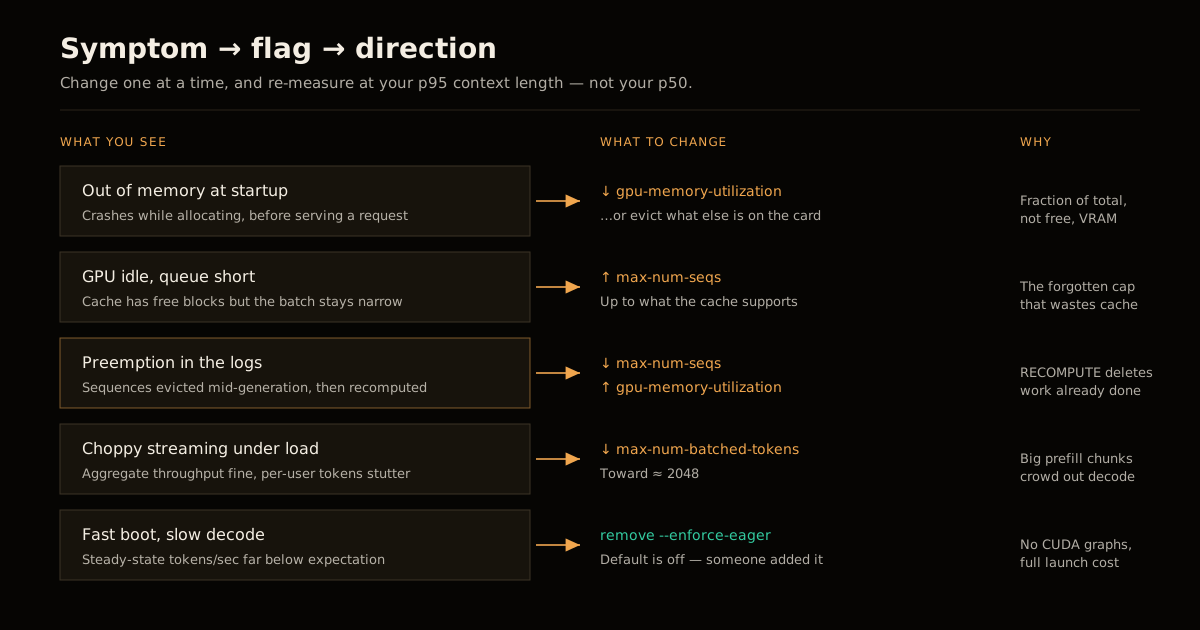
| Symptom | Change | Direction |
|---|---|---|
| OOM at startup | --gpu-memory-utilization | Down — or evict whatever else is on the card |
| GPU idle, queue short | --max-num-seqs | Up, to the concurrency your cache supports |
| Preemption in the logs | --max-num-seqs down, or --gpu-memory-utilization up | Narrow the batch or widen the cache |
| Choppy streaming under load | --max-num-batched-tokens | Down toward 2048 |
| Fast boot, slow decode | --enforce-eager | Remove it |
What most teams get wrong
Tuning before measuring average context length. Every number above is per token of context. If you do not know your p50 and p95 prompt plus generation length, you cannot size anything — and the p95 is what causes preemption. This is the same discipline as building a real eval harness before optimising a model: measure the workload, then change one thing.
Copying a config from a blog post about a different model. A 70B model with MHA and a 8B model with GQA differ by more than 10× in bytes per token. Config values are not portable across architectures; the block formula is.
Reaching for a bigger GPU first. Halving context length, moving to a GQA model, or recovering a defensive 0.80 are all cheaper than another H100, and any of them can beat one. The 70B-on-4GB layered-inference approach sits at the other extreme of this same trade — throughput surrendered to fit memory — and is worth understanding before you assume hardware is the answer.
Treating throughput as the only metric. Aggregate tokens/sec and per-user streaming smoothness pull in opposite directions through --max-num-batched-tokens. Decide which one your product sells before you tune. That decision belongs with the rest of the gap between a working demo and a production system.
Do this before your next deploy
- Compute bytes per token for your exact model with the block formula. It takes two minutes and it is the only number you will reuse.
- Measure p50 and p95 total context on real traffic.
- Set
--gpu-memory-utilizationas high as stable, and record what the remaining headroom is for. - Set
--max-num-seqsto the concurrency your cache supports at p95, not p50. - Pick
--max-num-batched-tokensby product: above 8192 for batch, near 2048 for interactive. - Delete
--enforce-eagerfrom anything that is not your laptop.
If you are running models on your own machine rather than a serving fleet, the same memory arithmetic decides what is even loadable — the local coding-model setup is that math applied at the other end of the scale.
The takeaway
vLLM’s defaults are tuned to boot successfully on unknown hardware, not to maximise your tokens/sec. That is the right default for a project serving thousands of configurations and the wrong one for your fleet. The block formula turns your model and your traffic into a concrete concurrency number, and once you have it, all four flags stop being guesses.
If you are scaling beyond a single node, the memory hierarchy extends into the network — the same bottleneck-first thinking applies to eliminating PCIe overhead in distributed training, where the GPU-to-NIC path becomes the constraint that all your local tuning cannot overcome.
FAQ
What actually limits vLLM throughput? KV cache capacity in VRAM. vLLM stores keys and values in fixed 16-token paged blocks, and a request can only join the running batch if free blocks exist for it. When the pool empties, requests queue and running ones get preempted — throughput flattens regardless of GPU speed.
What is the default gpu_memory_utilization? 0.92 in current vLLM. It is a fraction of total VRAM, not free VRAM, which is why an unrelated process on the card produces a startup OOM that looks like a model-size problem.
Should I raise max_num_batched_tokens? Above 8192 if you are optimising aggregate throughput, near 2048 if inter-token latency matters. It is the per-step budget shared between decode and chunked prefill, so raising it admits fatter prompt chunks and lowering it protects the decode stream.
Does --enforce-eager make vLLM faster? It makes startup faster and steady-state decode slower, by skipping CUDA graph capture. Since decode dominates a serving workload’s wall clock, it is a net loss anywhere except a development loop.
Why is vLLM preempting requests? The block pool ran out mid-generation. V1’s default preemption mode is RECOMPUTE, so the evicted sequence’s cache is discarded and rebuilt — pure wasted compute, and the clearest sign your batch width exceeds what the cache sustains.
Is prefix caching worth enabling? It defaults to True, so the job is not to enable it but to avoid disabling it and to put shared prompt content first so there is a prefix to match.
Sources
- Inside vLLM: Anatomy of a High-Throughput LLM Inference System — Aleksa Gordić’s engine walkthrough, source of the block-size formula and the V1 scheduler behaviour.
- vLLM — Optimization and Tuning — official guidance on
max_num_batched_tokens, chunked prefill defaults,enforce_eager, andRECOMPUTEpreemption. - vLLM
CacheConfigAPI reference — documented defaults forgpu_memory_utilization(0.92),block_size(16) andenable_prefix_caching(True).
For the security side of vLLM deployment — why CVE-2025-9141 matters and how to architect your inference stack to limit blast radius — see securing your LLM inference stack.
If self-hosting isn’t an option and you’re routing through a multi-provider gateway instead, the tradeoff isn’t free either: OpenRouter’s provider layer has its own set of production bugs — inconsistent quantization, ignored reasoning.effort, and cascading failures when you pin providers without fallbacks.
Frequently asked questions
Google Search · Preferred sources
Prefer this site on Google
If you already read this writing, add umesh-malik.com as a Preferred Source. Google can then highlight it with a preferred badge in Top Stories, AI Overviews, and AI Mode — for you, not as a site-wide ranking boost.
Related Articles

LLM Engineering
Qwen3.8 27B VRAM: how to fit 262K context in 16 GiB, not 64
Qwen3.8 27B VRAM math: 25.9 GiB of FP8 weights plus 16 GiB of KV cache at 262,144 tokens, not 64. The arithmetic, and where a 48 GB card breaks.

LLM Engineering
Run 70B LLM on 4GB GPU: AirLLM's Real Tradeoff
Run 70B LLM on 4GB GPU hardware with AirLLM's layer-by-layer inference. The VRAM math is real — you just pay for it in disk bandwidth. The honest tradeoff.

LLM Engineering
How to Fix Multi-Agent LLM Latency: Text Handoffs Cost 2.5x
Multi-agent LLM latency isn't random: an ICLR 2026 paper measured the cause — text handoffs cost 2.5x more time and 3-5% less accuracy than skipping text.
Keep reading
Get new posts on AI, Claude Code & LLMs
New deep-dives on AI engineering, Claude Code, and developer tooling — follow along however you prefer.
About the Author

Software engineer writing about AI, Claude Code, LLMs, OpenAI, Anthropic, and developer tooling. 5+ years building production systems at Expedia Group, Tekion, and BYJU'S.