Traffic Anomaly or Outage? What a 30% Drop Actually Means
A 15-30% traffic anomaly or outage? Cloudflare's eclipse analysis shows the fix: five-minute buckets against a three-week matched baseline.

TL;DR
Traffic anomaly or outage? The question every on-call engineer dreads has a mechanical answer: compare the drop against a baseline matched by time-of-day and day-of-week, then check whether the deviation’s timing lines up with an independent, verifiable cause. Cloudflare answered it in minutes for the August 12, 2026 solar eclipse — traffic fell 15-30% along the path of totality, and as much as -46.7% in the hardest-hit countries — by comparing five-minute traffic buckets against the median of the same slot on the three preceding Wednesdays, then confirming the drop’s shape matched the eclipse’s geometrically computed timing.
What actually happened during the eclipse
On August 12, 2026, a total solar eclipse crossed a path starting near Alaska around 15:35 UTC and sweeping through the North Atlantic into Europe. Cloudflare’s Radar team documented the traffic impact as the moon’s shadow moved: “regions along the path of totality saw traffic fall by roughly 15% to 30%” at the moment of maximum obscuration.
Individual countries moved even more — the full range across affected regions was “9.3 to -46.7%” — with Iceland, Spain, and Portugal registering the steepest declines, alongside smaller drops in Ireland, the UK, and France. Countries with only shallow partial coverage, like Sweden, Denmark, Poland, and Switzerland, showed close to nothing. That’s a bigger swing than most teams would tolerate silently: a 30-46% drop in request volume, in a five-to-twenty-minute window, is the kind of number that pages an on-call engineer at 3 a.m.
The interesting part isn’t that traffic dropped — outdoor daylight events pulling people off their phones is intuitive. The interesting part is how Cloudflare proved it was the eclipse and not a routing problem, a DNS issue, or a partial regional outage, all of which produce the exact same symptom: a sudden request-volume cliff.
Traffic anomaly or outage: the method that actually decides it
Cloudflare’s stated methodology was specific: “We compared eclipse day against the same weekday: the median of the three previous Wednesdays, matched slot-by-slot on time-of-day.” Traffic was bucketed into five-minute windows, and each window on eclipse day was checked against the median of that identical five-minute window on the prior three Wednesdays — not against yesterday, not against a rolling daily average, and not against a single reference day.
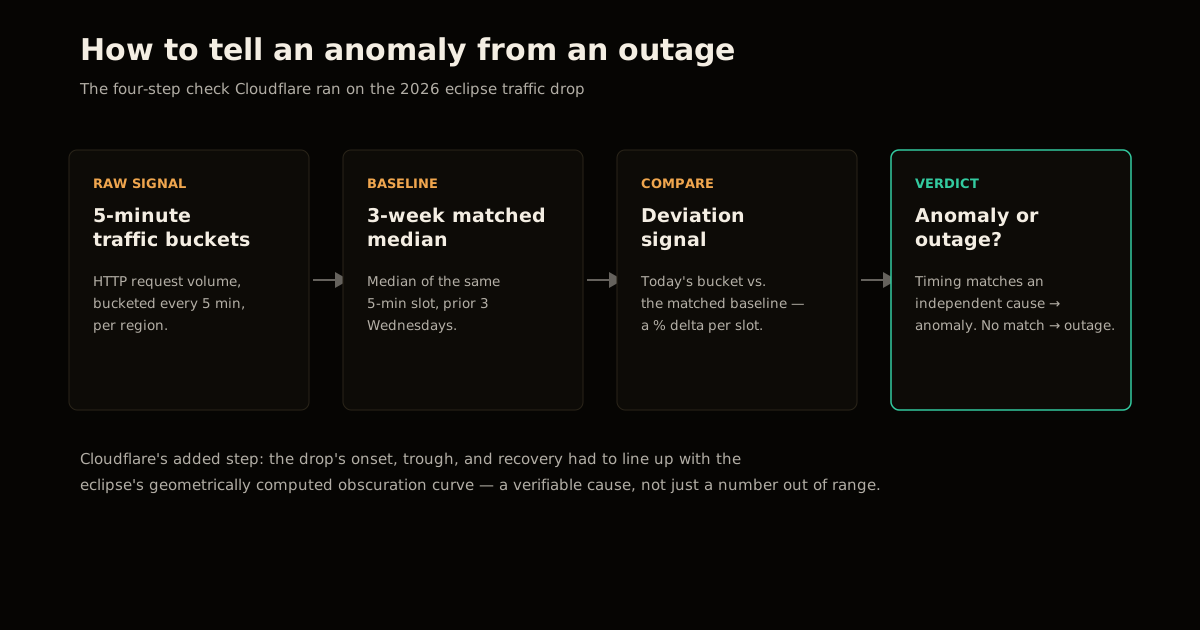
Then came the step that actually establishes causation rather than mere correlation: they checked the timing. The obscuration percentage at each location was computed geometrically from real sun and moon positions, and the traffic dip’s shape — onset, trough, and recovery — was checked against that computed obscuration curve at each location.
Cloudflare’s own framing: “Paired with the precise timing of the drops, the trend of the data demonstrates that the eclipse itself was the primary driver of the decline.” A drop that lines up minute-for-minute with an independently computable physical event is not the same kind of evidence as a drop that merely happened during the day.
Why naive baselines lie
Most homegrown anomaly detectors compare against something too crude to survive contact with real-world variance:
| Naive baseline | What breaks it |
|---|---|
| “Compare to yesterday” | Day-of-week effects (Wednesday ≠ Tuesday) dwarf small real signals |
| “Compare to a flat daily average” | Erases the intraday shape — traffic isn’t flat across 24 hours, so every trough looks anomalous |
| “Compare to last week, same day” | One sample is still noisy; a single unusual prior week poisons every comparison after it |
| “Alert on any % deviation” | No mechanism to separate a real external cause from ordinary variance, so every threshold is a guess |
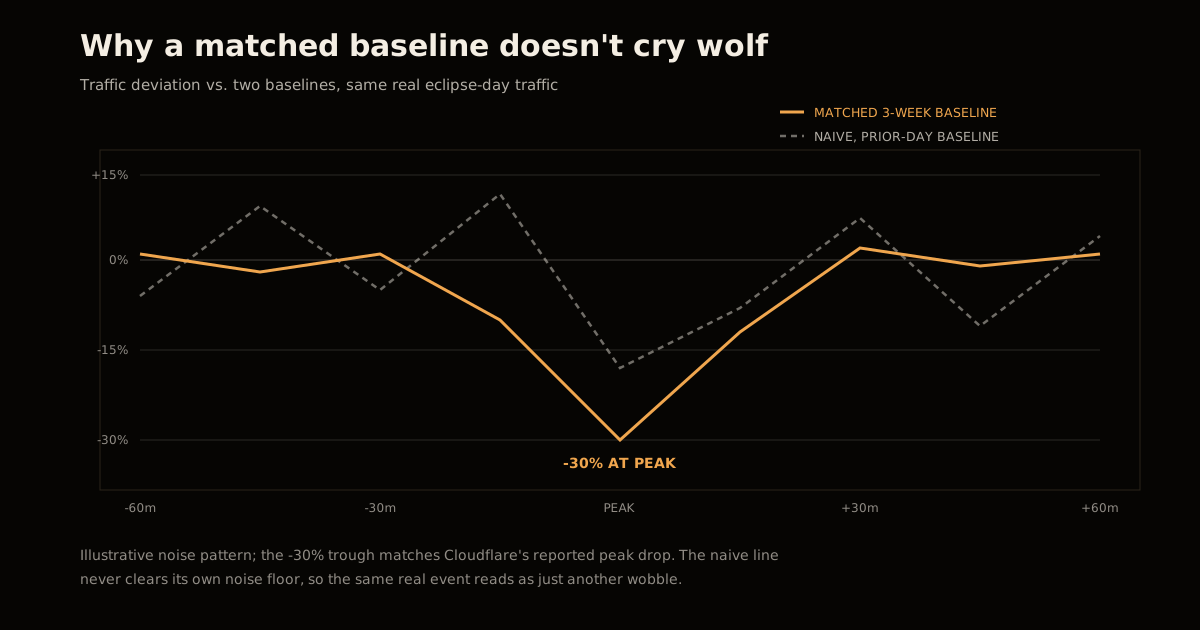
Cloudflare’s baseline avoids all four failure modes at once. Matching by time-of-day removes the intraday shape. Matching by weekday removes the day-of-week effect. Taking the median of three weeks, not one, removes single-week noise without being distorted by one outlier week the way a mean would be.
Building this yourself: a baseline that doesn’t cry wolf
You don’t need Cloudflare’s edge network to apply the same logic to your own traffic, request-rate, or error-rate monitoring:
- Bucket at the resolution of the event you care about. Five minutes is a solid default for web traffic — coarse enough to smooth per-request noise, fine enough to catch anything that resolves within 15-20 minutes. If your real events are shorter, tighten the bucket.
- Match by time-of-day and day-of-week, not just by date. A Wednesday-at-3pm bucket should be compared to prior Wednesdays at 3pm, never to Tuesday at 3pm or to Wednesday at 9am.
- Take the median across 3+ prior matched windows, not the mean of one or two. The median is robust to a single unusual prior week (an outage, a holiday, a promo) in a way a two-sample average never is.
- Require a second, independent signal before calling it a real anomaly. Cloudflare had the eclipse’s geometric timing. You might have a deploy timestamp, a known maintenance window, a marketing campaign’s send time, or a correlated metric (CPU, upstream latency) moving in the same shape. Deviation alone is a symptom; deviation plus a matching independent cause is a diagnosis.
- Only page on deviation without an independent cause. If the drop matches nothing you can explain, that’s exactly the case worth waking someone up for — you’ve now filtered out the explainable noise, so what’s left is genuinely worth investigating.
Common mistakes
The single biggest mistake is treating “deviation from baseline” and “root cause identified” as the same finding. They aren’t. A baseline tells you that something changed; it never tells you why. Teams that stop at step 1-3 above end up with dashboards that are technically correct and practically useless — every real anomaly looks identical to a genuine incident until someone manually checks for an external cause, which is exactly the step Cloudflare didn’t skip.
The second mistake is picking a bucket size and baseline window once and never revisiting them as traffic patterns shift — a baseline tuned for pre-pandemic office-hours traffic, for instance, will misfire constantly against post-2020 traffic shapes. Re-validate your baseline’s assumptions whenever you meaningfully change what “normal” looks like for your service.
The takeaway
A 15-30% traffic drop is not, by itself, evidence of anything. It’s the shape of the drop against a properly matched baseline, plus an independent explanation for its exact timing, that turns a scary number into either “expected, stand down” or “genuinely worth paging someone.” Cloudflare had a solar eclipse as its independent signal. Most teams have deploy logs, feature-flag timestamps, and marketing calendars sitting right there, unused, the next time a dashboard spikes red.
If you’re building alerting on top of Cloudflare Workers, see how Cloudflare Access and removing unnecessary beacon scripts affect what you’re even measuring. For the discipline of tracing a symptom back to a verified root cause, the same rigor shows up in debugging an EEVDF latency regression and in running a zero-downtime dual-write migration — both are exercises in not trusting the first plausible explanation. And if your traffic anomaly turns out to be automated rather than seasonal, verifying crawler IPs instead of trusting User-Agent strings is the next place to look. Once an AI agent is the one triaging the alert this baseline generates, AI incident response skill decay covers the tradeoff that shows up next: routine anomalies get resolved faster, but the humans who’d normally handle the genuinely novel ones get less practice doing it.
FAQ
How do you tell a real traffic anomaly from an outage? You compare the drop against a baseline built from the same time-of-day and day-of-week, not against yesterday or a flat average. If the deviation lines up precisely with a known external cause — a scheduled event, a regional pattern, a correlated signal — and recovers on the same timeline that cause predicts, it’s an anomaly, not an outage. An outage has no such external correlate and typically doesn’t self-correct on a predictable schedule.
Why is comparing traffic to yesterday a bad baseline? Day-of-week effects are large enough to swamp small real signals — enterprise traffic on a Wednesday can differ from a Tuesday by more than the anomaly you’re trying to detect. A single prior day is also one noisy sample, so any randomness in that one day becomes randomness in your alert threshold. A multi-week, same-weekday, same-time-slot median averages that noise out before you ever compare it to today.
What is Cloudflare Radar and what did it measure for the 2026 eclipse? Cloudflare Radar is Cloudflare’s public internet-traffic-and-trends dashboard, drawing on request data from its global edge network. For the August 12, 2026 total solar eclipse, Radar’s team compared HTTP request volume in five-minute buckets against a baseline built from the three preceding Wednesdays at matching times of day, and found traffic changes ranging from +9.3% to -46.7% across affected countries, with the deepest drops in Iceland, Spain, and Portugal.
What bucket size should I use for anomaly detection? Five minutes is a reasonable default for web traffic: coarse enough to smooth out per-request jitter, fine enough to catch a drop that starts and ends within 15-20 minutes. Match your bucket size to the shortest real event you care about — if you need to catch something that resolves in under five minutes, bucket at one or two minutes instead.
Does differential privacy or noise correction matter for this kind of baseline? Not for this specific case — aggregate HTTP request counts across a whole country aren’t sensitive per-user data, so Cloudflare’s eclipse analysis didn’t need privacy-preserving noise. That technique matters for a different problem: when the metric itself could reveal something about an individual, which is a concern in on-device telemetry pipelines, not in coarse regional traffic monitoring.
If the drop you’re diagnosing coincides with a live cutover rather than a celestial event, the baseline question is the same but the fix is different — see how a staged, fallback-aware rollout keeps a migration’s bad guess from ever showing up as an outage.
Sources
- Cloudflare, “Total eclipse of the Internet: traffic impacts in Iceland, Spain, and Portugal” — the traffic percentages, methodology, and timing correlation cited throughout.
- Cloudflare Radar — the public dashboard the analysis draws from, for readers who want to explore live global traffic trends.
Frequently asked questions
Google Search · Preferred sources
Prefer this site on Google
If you already read this writing, add umesh-malik.com as a Preferred Source. Google can then highlight it with a preferred badge in Top Stories, AI Overviews, and AI Mode — for you, not as a site-wide ranking boost.
Related Articles

Web Engineering
Post-Quantum TLS Migration: Stop Paying the 150ms Retry Tax
Post-quantum TLS migration checklist: X25519MLKEM768 cut Cloudflare's handshake retries from 52% to 3.7%. How to check, enable, and verify on your own origin.

Web Engineering
How to Give an AI Agent CMS Write Access Without Melting the Cache
AI agent CMS write access breaks caches fast. The layered invalidation pattern that let one CMS absorb 5,000 RPS spikes and a 28,000 RPS DDoS without a hiccup.

Web Engineering
Configure Optional OAuth Scopes for MCP Servers and Agents
Configure optional OAuth scopes so users can narrow agent permissions at consent. The API call, the UX, and handling partial grants.
Keep reading
Get new posts on AI, Claude Code & LLMs
New deep-dives on AI engineering, Claude Code, and developer tooling — follow along however you prefer.
About the Author

Software engineer writing about AI, Claude Code, LLMs, OpenAI, Anthropic, and developer tooling. 5+ years building production systems at Expedia Group, Tekion, and BYJU'S.