How to Fix Core Web Vitals: LCP, INP & CLS (2026)
A hands-on guide to optimizing Core Web Vitals (LCP, INP, CLS). Covers measurement, diagnosis, and specific fixes with before/after examples from real projects.

Core Web Vitals directly impact search ranking and user experience. After optimizing several production applications, here’s my practical playbook for hitting good scores on all three metrics. Core Web Vitals is Google’s name for three field metrics — LCP, INP, and CLS — that measure loading speed, responsiveness, and visual stability as real users experience a page. For the component layer, pair this with my React performance optimization techniques — and to keep the gains from regressing, a solid frontend testing strategy. See also The $1,100 Framework That Just Made Vercel’s $3 Billion Moat Obsolete.
TL;DR
- Treat LCP, INP, and CLS as three different failure modes — the fix for one rarely helps the other two.
- LCP: preload the real hero asset, serve responsive images, and cut server response time. Target under 2.5s.
- INP: keep the main thread free — break up long tasks, debounce handlers, defer non-urgent state updates. Target under 200ms.
- CLS: reserve space before content arrives with explicit dimensions and
aspect-ratio. Target under 0.1. - Measure with the
web-vitalslibrary on real traffic — lab scores from Lighthouse alone will mislead you.
WEB VITALS IN ONE SCREEN
The fastest way to improve Core Web Vitals is to treat each metric as a different kind of failure mode. They do not respond to the same fixes.
LCP
Fix what delays the largest visible element
Largest Contentful Paint is usually an image, hero block, or large text section arriving too late.
- Preload the real hero asset
- Reduce server response time
- Avoid oversized unresponsive media
INP
Remove long tasks from interaction paths
Interaction to Next Paint is mainly about keeping the main thread free enough to respond when users click or type.
- Break synchronous work into chunks
- Defer non-urgent updates
- Debounce search-heavy interactions
CLS
Reserve space before content arrives
Cumulative Layout Shift punishes surprise movement. The fix is usually explicit dimensions and stable placeholders.
- Set media dimensions
- Reserve async content slots
- Avoid injecting banners above existing content
MEASUREMENT
Use field data before declaring victory
Lab scores are useful for diagnosis, but real-user telemetry is what tells you whether the experience is actually improving.
- Collect `web-vitals` data
- Track regressions over time
- Validate on realistic devices and networks
What Is Core Web Vitals?
Google groups Core Web Vitals into three thresholds — good, needs improvement, and poor — and uses the 75th percentile of real visits to decide which bucket a page lands in. That percentile choice matters: it means one slow device or one bad connection sample doesn’t sink your score, but a genuinely slow experience for a quarter of your traffic will.
| Metric | Measures | Good | Needs Work | Poor |
|---|---|---|---|---|
| LCP (Largest Contentful Paint) | Loading | < 2.5s | 2.5-4.0s | > 4.0s |
| INP (Interaction to Next Paint) | Interactivity | < 200ms | 200-500ms | > 500ms |
| CLS (Cumulative Layout Shift) | Visual stability | < 0.1 | 0.1-0.25 | > 0.25 |
These are field metrics, meaning Chrome collects them from actual visitors and reports them through the Chrome User Experience Report (CrUX). Lighthouse gives you lab estimates of the same three metrics, which are useful for local debugging, but Google Search ranks pages using field data, not lab scores.
Measuring Before Optimizing
Always measure in the field, not just in lab conditions.
// web-vitals library
import { onLCP, onINP, onCLS } from 'web-vitals';

function sendToAnalytics(metric) {
  const body = JSON.stringify({
    name: metric.name,
    value: metric.value,
    delta: metric.delta,
    id: metric.id,
    navigationType: metric.navigationType,
  });
  navigator.sendBeacon('/api/analytics', body);
}

onLCP(sendToAnalytics);
onINP(sendToAnalytics);
onCLS(sendToAnalytics);
Optimizing LCP
LCP measures when the largest content element becomes visible. It’s usually a hero image, heading, or text block.
What Is a Good LCP Score in 2026?
Anything under 2.5 seconds at the 75th percentile counts as good. In practice, that number is generous — a well-built page on a decent connection should land closer to 1-1.5s. The gap between “passing” and “fast” is where most of the perceived-speed win actually lives, and it’s usually the same handful of fixes: preload the real hero asset, skip a render-blocking CSS/JS chain, and keep the server response under a few hundred milliseconds.
Four sub-parts make up LCP, and each one is a separate lever: time to first byte, resource load delay, resource load time, and render delay. If your server responds fast but LCP is still slow, the bottleneck has moved to render delay — usually JavaScript blocking the main thread before the browser can paint.
1. Preload the LCP Image
<!-- In <head> — tell the browser about the hero image early -->
<link rel="preload" as="image" href="/hero-image.webp" fetchpriority="high" />
2. Use Responsive Images
<img
  src="/hero-800.webp"
  srcset="/hero-400.webp 400w, /hero-800.webp 800w, /hero-1200.webp 1200w"
  sizes="(max-width: 768px) 100vw, 800px"
  alt="Hero image"
  width="800"
  height="400"
  fetchpriority="high"
  decoding="async"
/>
3. Optimize Server Response Time
// SvelteKit example: cache expensive data
export const load: PageServerLoad = async ({ setHeaders }) => {
  setHeaders({
    'Cache-Control': 'public, max-age=3600, s-maxage=86400',
  });

  const data = await fetchExpensiveData();
  return { data };
};
4. Inline Critical CSS
For SvelteKit, CSS is automatically inlined during SSR. For other frameworks, use tools like critters:
// vite.config.ts
import critters from 'critters-webpack-plugin';

// This inlines above-the-fold CSS and defers the rest
Optimizing INP
INP (Interaction to Next Paint) replaced FID in 2024. It measures the responsiveness of all interactions, not just the first one.
How Do You Fix a Poor INP Score?
Start by finding which interactions are slow, not just that INP is slow overall. Chrome DevTools’ Performance panel and the Interactions track in Lighthouse both flag the specific click, tap, or keypress that dragged the metric down — usually one heavy handler, not the whole page. Fixing INP is almost always about reducing the amount of synchronous work a single interaction triggers, not about making the page “faster” in general.
The three biggest INP offenders in real codebases: a click handler that synchronously re-renders a large list, a third-party script (chat widgets, ad tags, analytics SDKs) that hogs the main thread right when a user interacts, and event handlers that do expensive work before the next paint instead of after it. scheduler.yield() and startTransition both exist to solve the same underlying problem — give the browser a chance to paint before you finish the rest of the work.
1. Break Up Long Tasks
// Before: one long synchronous operation
function processLargeDataset(items) {
  items.forEach(item => heavyTransform(item)); // Blocks for 300ms
}

// After: yield to the main thread
async function processLargeDataset(items) {
  const chunks = chunkArray(items, 50);
  for (const chunk of chunks) {
    chunk.forEach(item => heavyTransform(item));
    await scheduler.yield(); // Let the browser handle pending interactions
  }
}
2. Use startTransition for Non-Urgent Updates (React)
import { startTransition } from 'react';

function SearchComponent() {
  const [query, setQuery] = useState('');
  const [results, setResults] = useState([]);

  function handleChange(e) {
    setQuery(e.target.value); // Urgent: update input immediately

    startTransition(() => {
      setResults(filterResults(e.target.value)); // Non-urgent: can be deferred
    });
  }
}
3. Debounce Event Handlers
function debounce<T extends (...args: any[]) => void>(fn: T, ms: number): T {
  let timer: ReturnType<typeof setTimeout>;
  return ((...args: Parameters<T>) => {
    clearTimeout(timer);
    timer = setTimeout(() => fn(...args), ms);
  }) as T;
}

// Usage
input.addEventListener('input', debounce(handleSearch, 200));
Optimizing CLS
CLS measures unexpected layout shifts. It’s the most frustrating metric for users.
Why Does CLS Still Break After You “Fixed” It?
Because most teams only fix the layout shifts they can see. CLS accumulates from every unexpected shift during a page’s lifespan, including ones that happen well after load — a lazy-loaded ad slot that resolves late, a web font swap that changes line length, or a client-side redirect that swaps content after hydration. Fixing the hero image’s dimensions kills the biggest, most visible shift, but a font-swap shift or a late-arriving cookie banner can still push the score into “needs improvement.”
font-display: optional or size-adjust in a @font-face block avoids the font-swap shift entirely at the cost of occasionally keeping the fallback font. If that tradeoff isn’t acceptable, matching the fallback font’s metrics to the real font (via unicode-range and ascent-override/descent-override) removes the shift without changing what text ends up on screen.
1. Always Set Image Dimensions
<!-- Bad: causes layout shift when image loads -->
<img src="/photo.webp" alt="Photo" />

<!-- Good: browser reserves space -->
<img src="/photo.webp" alt="Photo" width="800" height="600" />
2. Use CSS aspect-ratio for Dynamic Content
.video-container {
  aspect-ratio: 16 / 9;
  width: 100%;
  background: #1a1a1a;
}
3. Reserve Space for Async Content
/* Reserve space for an ad slot or dynamic banner */
.ad-slot {
  min-height: 250px;
  contain: layout;
}
4. Avoid Inserting Content Above Existing Content
This is the most common CLS offender. Cookie banners, notification bars, and lazy-loaded headers all push content down.
/* Pin dynamic banners to the top of the viewport */
.notification-bar {
  position: fixed;
  top: 0;
  left: 0;
  right: 0;
  z-index: 50;
}
Real Results
On this portfolio site, after applying these optimizations:
| Metric | Before | After |
|---|---|---|
| LCP | 3.2s | 1.4s |
| INP | 180ms | 45ms |
| CLS | 0.12 | 0.01 |
| Lighthouse Score | 78 | 98 |
The biggest wins came from image optimization (LCP), removing synchronous third-party scripts (INP), and setting explicit dimensions on all media (CLS).
START WITH THE BIGGEST LEVERS
Most Web Vitals work is not a giant rewrite. It is a sequence of targeted fixes that remove very specific bottlenecks.
HIGH-LEVERAGE FIXES
These changes usually move the metrics fastest
- Preload and right-size your true LCP asset
- Remove or defer blocking third-party scripts
- Break up long interaction handlers and heavy transforms
- Set explicit dimensions or aspect ratios on all media and embeds
COMMON WASTE
These patterns slow teams down without solving much
- Chasing Lighthouse points without field measurement
- Optimizing tiny components while the hero image is still oversized
- Ignoring CLS until banners and ads start shifting the page
- Testing only on fast laptops and office Wi-Fi
Key Takeaways
- Measure in the field using the
web-vitalslibrary, not just Lighthouse - LCP: preload hero images and optimize server response time
- INP: break long tasks, debounce handlers, use
startTransition - CLS: always set image dimensions and reserve space for dynamic content
- Small, targeted fixes often deliver the biggest improvements
- Test on real devices — your development machine isn’t representative
INP and bundle weight are related more than they look: less JavaScript parsing and fewer reactivity mechanics competing for the main thread means shorter tasks. An 855-byte Proxy-based reactive core is the extreme end of that trade-off, traced line by line.
FAQ
Questions readers usually have
Sources
Google Search · Preferred sources
Prefer this site on Google
If you already read this writing, add umesh-malik.com as a Preferred Source. Google can then highlight it with a preferred badge in Top Stories, AI Overviews, and AI Mode — for you, not as a site-wide ranking boost.
Related Articles
Web Engineering
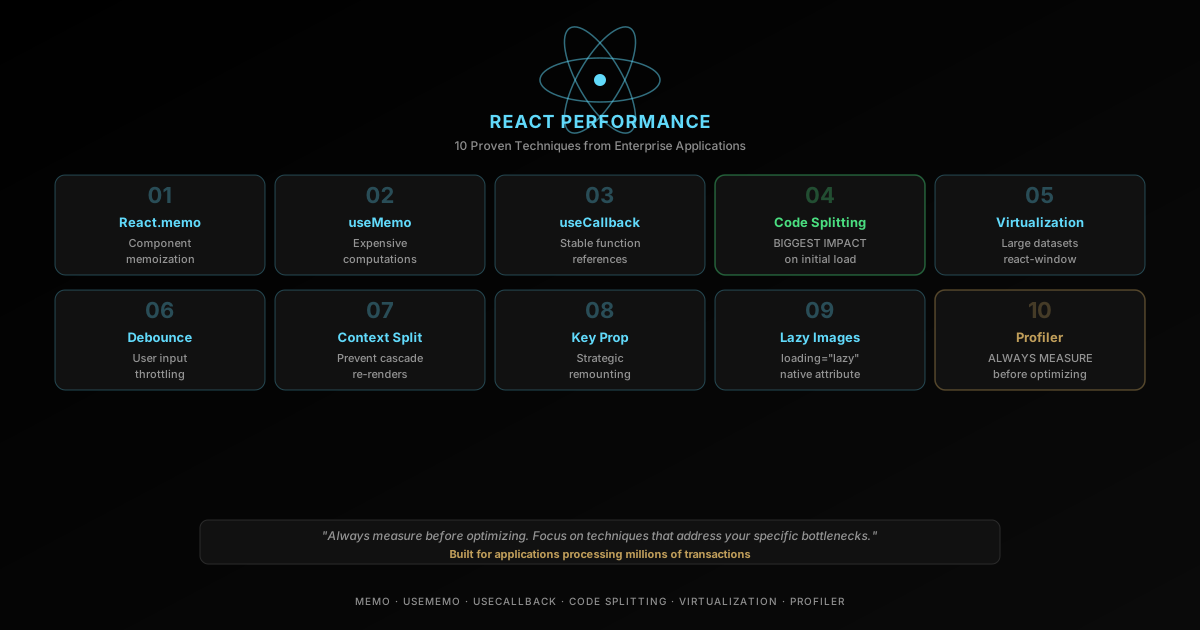
React Performance Optimization: 10 Proven Techniques
React performance optimization techniques — memoization, code splitting, virtualization, and 7 more battle-tested strategies from real apps.

Web Engineering
Fix Shadow DOM innerHTML not working: use setHTMLUnsafe
Shadow DOM innerHTML not working is a parsing gap, not a bug — it silently skips declarative shadow roots. Use setHTMLUnsafe() instead, plus five more gotchas.

Web Engineering
Build JavaScript Proxy Reactive State: 855 Bytes, No Framework
Javascript proxy reactive state in under a kilobyte: an 80-line get/set trap that tracks reads, batches writes, and quietly breaks on one property name.
Keep reading
Get new posts on AI, Claude Code & LLMs
New deep-dives on AI engineering, Claude Code, and developer tooling — follow along however you prefer.
About the Author

Software engineer writing about AI, Claude Code, LLMs, OpenAI, Anthropic, and developer tooling. 5+ years building production systems at Expedia Group, Tekion, and BYJU'S.