Fix Performance Regressions With a Benchmark Ratchet (3.1x, 0 Breaks)
Fix performance regressions with a benchmark ratchet that fails CI on regression and locks in wins. How Claude shipped 3,000 changes at 3.1x, zero breaks.

TL;DR To fix performance regressions for good, stop relying on code review to catch them and add a benchmark ratchet: a CI check that fails on any regression and never lets a win quietly slide back. Claude’s engineering team paired that with instruction-level profiling and a mandatory correlation-proof step, and shipped roughly 3,000 performance changes at a 3.1x geometric-mean speedup (p75) with zero customer-facing incidents. The pattern — profile the real hot path, prove the benchmark matches what users feel, then ratchet it — works for any product with a metric worth protecting.
Most teams fix a slow page once and lose the win within a quarter. Someone adds a modal, a library upgrade pulls in 40KB nobody audited, and the metric drifts back to where it started — because nothing in CI was watching it. Anthropic’s account of speeding up Claude.ai and Claude Code is a rare public writeup of a team that closed that loop mechanically instead of relying on vigilance, and the numbers are concrete enough to learn from directly.
How to Fix Performance Regressions Before They Ship
The short version: you can’t fix performance regressions with a style guide, because a style guide has no teeth. You fix them by making a regression a failed build, the same way a broken type or a failing unit test is a failed build. That requires three pieces working together — a profiler that finds the real cost, a validation step that proves your benchmark means something, and a ratchet that makes the win permanent.
Skip any one piece and the other two stop working. Profile without a ratchet and every fix erodes within a few releases. Ratchet a benchmark nobody validated and you optimize a number instead of the product. Claude’s team tracked 13 metrics across four user journeys — app launch, starting a conversation, loading a conversation, and sending a message — specifically so the ratchet had real things to protect.
What Is a Benchmark Ratchet?
A benchmark ratchet is a CI gate that only allows a tracked metric to move in one direction: better, or unchanged. Any commit that regresses the number fails the build. Any commit that improves it resets the floor upward, so the new, better number becomes the new minimum bar every future commit has to clear. Nothing has to “remember” to keep a win — the gate enforces it.
This is a small mechanical change with an outsized effect on how a team behaves. Once a regression is a build failure instead of a discussion, engineers stop treating “did this get slower” as a judgment call. Claude’s team pushed close to 3,000 changes under a ratchet like this and reported zero regressions across the improvement cycles — not zero regressions attempted, zero that survived to ship.
The 3-Step Loop: Profile, Prove Correlation, Ratchet
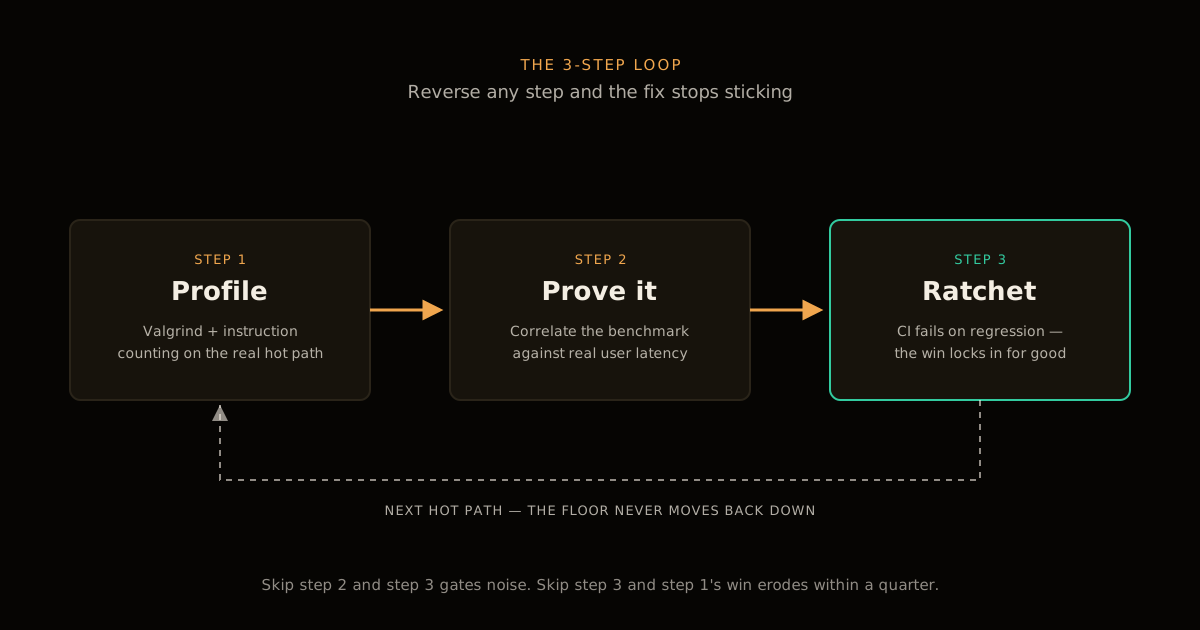
Here’s the loop, in the order that actually matters — reverse any step and it breaks.
1. Profile the real hot path, not the obvious one. Guessing where time goes is how teams optimize the wrong function for a quarter. Claude’s team used Valgrind with node --predictable for deterministic CPU instruction counting, V8’s precise coverage for function call counts, and Chrome DevTools frame stepping to get deterministic 120Hz frame data. That combination surfaced things a stopwatch never would — 6,900 React hooks and 900 subscriptions inside one composer component, and a single :root:has() CSS selector adding 24ms of style recalculation on its own.
2. Prove the benchmark reflects what a user actually feels. A synthetic number that doesn’t track real user latency is worse than no benchmark, because it gives you false confidence while you optimize noise. Claude’s team validated every candidate benchmark against real user monitoring (RUM) data before trusting it, with an explicit rule: unship any bench that can’t prove the correlation. This step is also where blind spots in standard metrics show up — Cumulative Layout Shift missed a real sidebar-jank problem because each individual shift scored under the 0.1 threshold, so the team added custom telemetry tracking shift sources by region and phase instead of trusting CLS alone.
3. Ratchet it, then ship behind a flag. Once a benchmark is validated, it goes into CI as a one-way gate. Rollout itself stays incremental and reversible: internal employees first, then 1%, then full traffic, behind a kill switch. Claude’s team ran close to 200 feature flags through this program and had retired more than half of them by the end of the sprint — a flag is scaffolding, not a permanent fixture.
The Numbers Behind the 3.1x Speedup
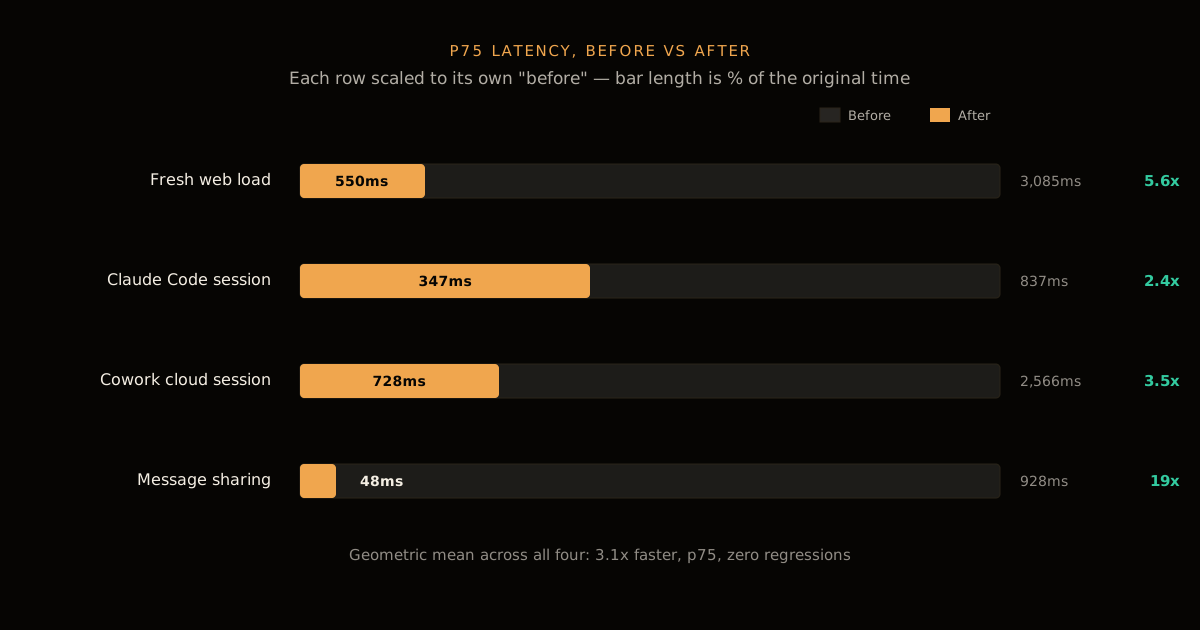
Aggregate numbers hide where the value actually landed, so it’s worth looking at the four measured journeys individually before trusting the geometric mean.
| Journey | Before (p75) | After (p75) | Speedup |
|---|---|---|---|
| Fresh web load | 3,085ms | 550ms | 5.6x |
| Starting a Claude Code session | 837ms | 347ms | 2.4x |
| Cowork cloud session | 2,566ms | 728ms | 3.5x |
| Sharing a message | 928ms | 48ms | 19x |
The message-sharing number is the outlier worth explaining rather than celebrating blindly: a 19x win on one platform usually means the original path was doing something structurally wrong (in this case, redundant client-side work on a share action), not that the team found 19x of “normal” optimization headroom. Read outliers like that as a signal to go find the equivalent bug elsewhere, not as the typical result to expect.
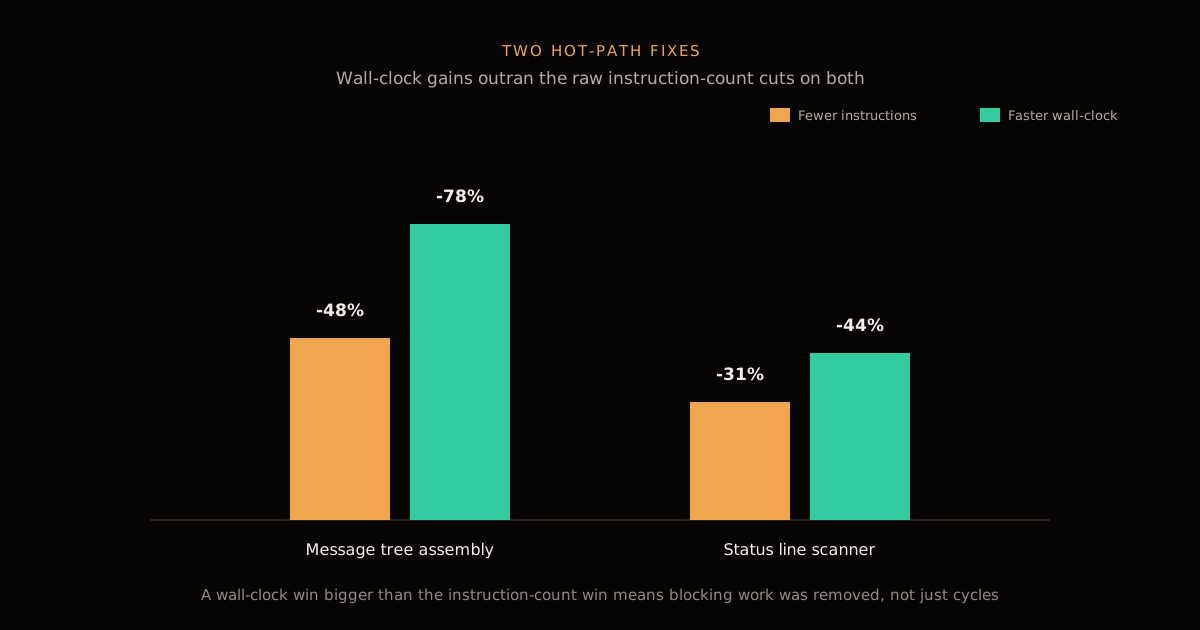
Two hot-path fixes show the same instruction-level discipline at smaller scale: message tree assembly dropped 48% of its CPU instructions and gained a 78% wall-clock improvement, and the status line scanner cut instructions by 31% for a 44% latency gain. In both cases the wall-clock win outran the instruction-count win, which is the tell that the fix removed synchronous blocking work, not just fewer cycles.
A Benchmark Ratchet vs Three Common Alternatives
Most teams already do one of the weaker options below. The ratchet isn’t a replacement for profiling or code review — it’s the piece that makes their wins stick.
| Approach | Catches regressions before merge? | Protects a past win from drifting back? | Needs custom telemetry? |
|---|---|---|---|
| Code review vigilance | Rarely — reviewers see the diff, not the runtime cost | No | No |
| Synthetic CI benchmark, no gate | Only if someone reads the report | No | No |
| Lighthouse / Core Web Vitals only | Partially — misses sub-threshold jank (see CLS above) | No | No |
| Benchmark ratchet (this post) | Yes — regression fails the build | Yes — floor only moves up | Yes, for the metrics stock tools miss |
The honest tradeoff: a ratchet needs upfront investment in validated benchmarks and a place to store the floor value per metric. Teams that skip straight to a ratchet without step 2 above end up gating merges on numbers nobody outside CI has ever felt, which trains engineers to route around the gate instead of trusting it.
Run This in Your Own Codebase: A 5-Step Rollout Procedure
Pick 3-5 metrics that map to a real user journey — not “everything Lighthouse reports.” Claude’s team tracked 13, but started smaller; app launch and your single most common user action are the highest-leverage first picks.
Instrument at the instruction level for the hot paths, not just wall-clock timers. A wall-clock number tells you something got slower; an instruction count and a call-count census tell you which function to open first.
Correlate every candidate benchmark against production RUM data before it can gate anything. If you don’t have RUM yet, ship that first — a ratchet on an unvalidated number is worse than no ratchet.
Add the ratchet to CI as a merge-blocking check, storing the current floor per metric so a regression fails loudly instead of shipping quietly.
Roll fixes out behind a flag with a kill switch, in increasing traffic slices, and set a retirement date for the flag when you create it — not after the rollout finishes.
What Breaks When You Skip the Correlation-Proof Step?
You end up with a green CI check and unhappy users, which is the worst combination because the dashboard actively argues against investigating. A synthetic benchmark can improve while real latency stays flat, or even regresses, if it’s measuring something users don’t experience the same way — a cold-cache scenario nobody hits in practice, or a code path guarded by a flag that’s off in production.
The failure is quiet by design: nobody gets paged, the ratchet keeps passing, and the gap between “our benchmark says we’re fast” and “our users say we’re slow” widens until a support ticket or a churn number forces someone to look. The fix is the one Claude’s team enforced as a rule, not a suggestion — unship any benchmark that can’t prove it tracks RUM, no matter how convenient it is to keep.
FAQ
What is a benchmark ratchet? A benchmark ratchet is a CI gate that only allows a tracked metric to move in one direction: better or unchanged. Any commit that makes the number worse fails the build automatically, and any commit that makes it better resets the floor, so a win can never quietly regress later. It turns “don’t make things slower” from a code-review norm into a mechanical rule.
How do you prove a synthetic benchmark reflects real user-perceived latency? You correlate the benchmark’s numbers against a real user monitoring (RUM) dashboard for the same metric before you trust it in CI, and you keep validating as you go. If a benchmark cannot show that correlation, you retire it rather than let it gate merges on a number nobody outside CI ever feels.
Do I need custom telemetry beyond Core Web Vitals like CLS? Often yes. Cumulative Layout Shift buckets shifts under 0.1 as fine, but several small shifts below that threshold can still read as visible jank to a user. Claude’s team had to add custom telemetry that tracked layout-shift sources by region and phase because the standard metric missed exactly that pattern.
How many feature flags is too many for a performance rollout? The number itself matters less than whether you retire them. Claude’s team introduced close to 200 flags for this program and had retired more than half by the end of the sprint. A flag that outlives its rollout window is a liability, not a safety net — track a removal date when you create it.
Can this ratchet method work outside a chat or LLM product? Yes — nothing about profiling, correlation-proofing, or ratcheting benchmarks is specific to chat UIs. The same three-step loop applies to any product with a metric you can measure automatically: page load, API latency, build time, query cost. The chat-app details here are the case study, not a requirement.
If you’re validating any vendor’s performance numbers before you build on them, the same skepticism applies to AI benchmark claims — see how to verify AI-generated benchmark claims for the equivalent discipline applied to model speed claims instead of app latency. For the frontend side of this same problem, 10 proven React performance techniques and cutting Node.js heap memory in half with pointer compression are two more measurement-first case studies worth reading next.
If your performance work is actually about what AI crawlers and agents see rather than human users, making PageSpeed Insights AI-ready covers that adjacent metric set. And if your bottleneck is agent tool-call cost rather than page latency, GitHub’s 20% cost fix was a prompt rewrite, not new infrastructure — the same “measure before you guess” discipline, applied to a different budget. For more on the Claude Code side of this case study, the Claude Code topic hub collects the adjacent tooling and workflow posts.
Sources
- Anthropic: How we made Claude.ai and Claude Code faster — the profiling methodology, the correlation-proof rule, the ratchet mechanism, and every metric cited in this post.
- web.dev: Cumulative Layout Shift — the Core Web Vitals definition and threshold this post’s CLS discussion references.
Frequently asked questions
Google Search · Preferred sources
Prefer this site on Google
If you already read this writing, add umesh-malik.com as a Preferred Source. Google can then highlight it with a preferred badge in Top Stories, AI Overviews, and AI Mode — for you, not as a site-wide ranking boost.
Related Articles

Web Engineering
Remove Cloudflare beacon.min.js: you must opt in to opt out
Remove Cloudflare beacon.min.js for good: the disable toggle hides behind adding your site to Web Analytics first, and no-transform is the stronger lever.

Web Engineering
React Server Components in 2026: The Mental Model, the use client Boundary & When Not to Use Them
React Server Components in 2026: the mental model that finally clicks, the use client boundary rules, and when NOT to use them — with the Web Vitals payoff.

Web Engineering
Fix Shadow DOM innerHTML not working: use setHTMLUnsafe
Shadow DOM innerHTML not working is a parsing gap, not a bug — it silently skips declarative shadow roots. Use setHTMLUnsafe() instead, plus five more gotchas.
Keep reading
Get new posts on AI, Claude Code & LLMs
New deep-dives on AI engineering, Claude Code, and developer tooling — follow along however you prefer.
About the Author

Software engineer writing about AI, Claude Code, LLMs, OpenAI, Anthropic, and developer tooling. 5+ years building production systems at Expedia Group, Tekion, and BYJU'S.