Fix a Postgres Storage Bottleneck: 5 Symptoms, 9.2x on NVMe
Fix a Postgres storage bottleneck: 3 queries to confirm it, and a test where local NVMe hit 9.2x the TPS of gp3. Plus the durability bill nobody quotes.

TL;DR If Postgres slows down on a large, write-heavy table while CPU sits idle, check storage before you touch the query. ClickHouse’s benchmark of random updates on a 482 GiB table measured 16,030 TPS on local NVMe against 1,734 TPS on 3,000-IOPS gp3, a 9.24x gap that came almost entirely from page reads and WAL fsync. The catch is that local NVMe moves durability from the disk to your cluster, so you pay for it in replication and backup work.
A Postgres storage bottleneck is a state where transactions spend most of their time waiting on disk reads or WAL fsyncs instead of executing, so adding CPU or tuning queries changes almost nothing.
I read ClickHouse’s recap of Sai Srirampur’s POSETTE 2026 talk because the title is a claim I have heard from three different teams. The raw numbers are good enough to be worth rebuilding into a diagnostic you can run on your own database this afternoon, and good enough to show where the claim stops being true.
What are the 5 symptoms of a Postgres storage bottleneck?
Five symptoms, and they all look like unrelated problems until you notice they share a disk. The talk lists them in the order teams usually meet them:
| Symptom | What you see | Why storage causes it |
|---|---|---|
| Slow ingestion | UPDATE and UPSERT jobs stretch from seconds to minutes | Each row touches a random heap page and a WAL record |
| Erratic reads | P95 drifts from milliseconds to seconds | Cache misses queue behind other I/O on a capped volume |
| Autovacuum lag | Bloat grows from gigabytes to terabytes | Vacuum is I/O-bound and loses the race with writes |
| Slow checkpoints | Checkpoints compete with client I/O | Dirty-page flushes share the same IOPS budget |
| Replication lag | Slot grows, WAL decoding is slow | Decoding reads WAL back from the same device |
Any one of these has a dozen non-storage explanations. Three or more at once, with idle CPU, is the pattern worth testing.
How much faster is local NVMe than gp3 for Postgres?
On the benchmarked workload, 9.24x on throughput and 9.2x lower latency. The setup was eight identical clusters on m6id.4xlarge (16 vCPUs, 64 GiB RAM, 16 GiB shared_buffers): four on instance-store NVMe, four on baseline gp3 at 3,000 IOPS. The dataset was a 482 GiB pgbench_accounts heap with 3.3 billion rows. The workload was random single-row UPDATEs for 5 minutes with 64 clients.
| Metric | gp3 (3,000 IOPS) | Local NVMe | Gap |
|---|---|---|---|
| Median throughput | 1,734 TPS | 16,030 TPS | 9.24x |
| Median transaction latency | 36.9 ms | 4.0 ms | 9.2x |
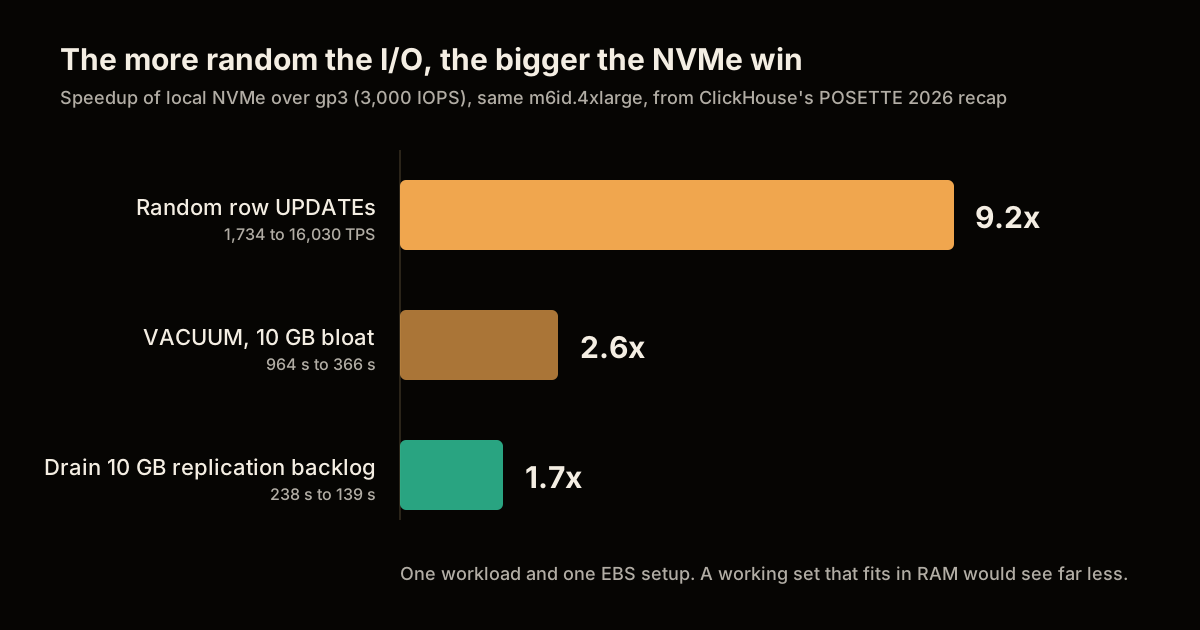
| VACUUM over 10 GB of bloat | 964 s | 366 s | 2.6x |
| Drain a 10 GB replication backlog | 238 s | 139 s | 1.7x |
The throughput and latency are consistent with each other, which is the first thing I check in any benchmark. With 64 clients in flight, Little’s law says throughput is 64 divided by latency: 64 / 0.0369 s is about 1,734 TPS and 64 / 0.0040 s is 16,000 TPS. Both match the reported medians, so the run was saturated and the latency is the whole story.
Where does the 9.2x come from?
The talk breaks the average transaction into four parts. On gp3, 35 of 37 milliseconds are not CPU.
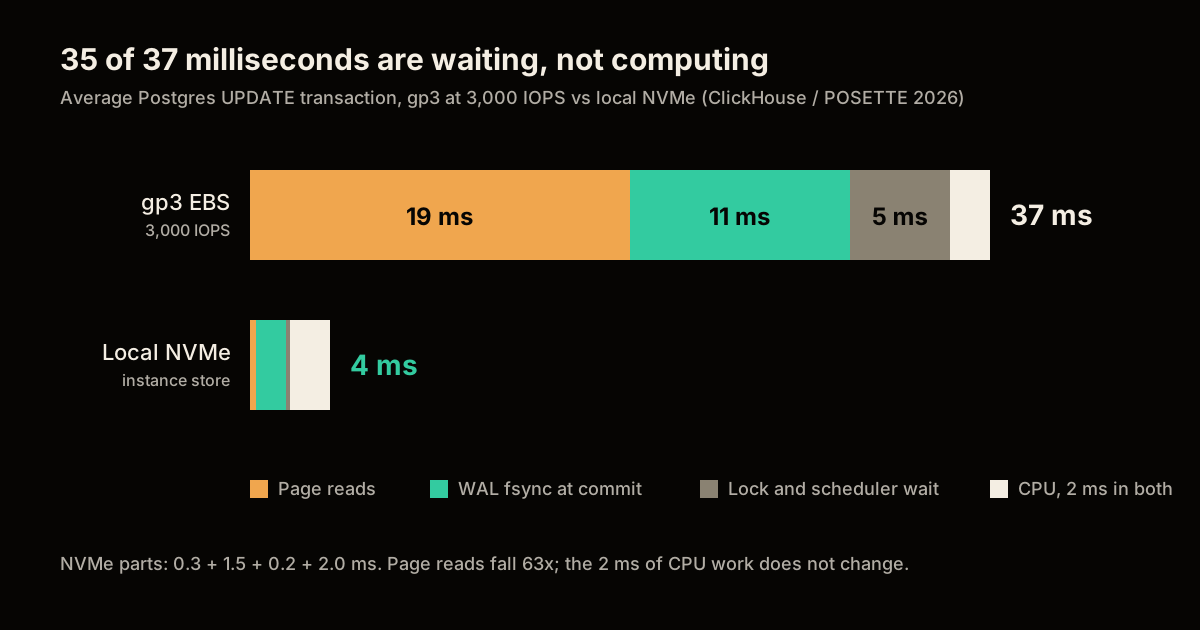
CPU work is 2 ms on both. Page reads fall from about 19 ms to 0.3 ms, a 63x drop, and WAL fsync at commit falls from about 11 ms to 1.5 ms. Even the 5 ms of lock and scheduler overhead is a storage symptom: backends hold locks longer while they wait on I/O, so everyone queues behind them.
Notice the third and fourth rows of the table. The gap shrinks to 2.6x for VACUUM and 1.7x for draining a replication backlog, because those jobs read mostly sequentially. The faster the device, the more it helps random I/O, and the less it helps everything else.
My read, not the talk’s: with a 16 GiB cache over a 482 GiB heap, nearly every random update misses the buffer cache. That is about one page read per transaction, and 1,734 TPS plus WAL fsyncs and checkpoint writes sits uncomfortably close to a 3,000 IOPS budget. I did not measure the volume’s IOPS, so treat that as a hypothesis to check on your own metrics.
How to check if Postgres is storage-bound in 4 steps
Sample the wait events under load. Run this a few times while the slowdown is happening.
SELECT wait_event_type, wait_event, count(*) AS backends
FROM pg_stat_activity
WHERE state = 'active' AND backend_type = 'client backend'
GROUP BY 1, 2
ORDER BY backends DESC;
Many backends on
IO / DataFileReadis the page-read signature. In the benchmark, one snapshot caught 29 of 64 backends there on gp3 against 9 on NVMe. That was a single reading, not an average, so sample repeatedly.Turn on I/O timing and compute milliseconds per read.
track_io_timinghas a small cost on most hardware; check withpg_test_timingif you are unsure.ALTER SYSTEM SET track_io_timing = on; SELECT pg_reload_conf(); SELECT round((blk_read_time / NULLIF(blks_read, 0))::numeric, 3) AS ms_per_read FROM pg_stat_database WHERE datname = current_database();Reset the counters with
pg_stat_reset()before the test so the average is not diluted by quiet hours. Compare against your own idle baseline: the signal is read latency that climbs with load.Break it down by backend type on Postgres 16 or later.
pg_stat_ioseparates client reads from checkpointer, autovacuum and WAL work.SELECT backend_type, object, context, reads, round(read_time::numeric / NULLIF(reads, 0), 3) AS ms_per_read, fsyncs, round(fsync_time::numeric / NULLIF(fsyncs, 0), 3) AS ms_per_fsync FROM pg_stat_io WHERE reads > 0 OR fsyncs > 0 ORDER BY read_time DESC NULLS LAST;Test the WAL volume on its own. Run
pg_test_fsync -f <a file on the WAL volume>and compare the fsync numbers with the commit latency you see. If commits are slow and CPU is idle, the commit path is waiting onfsync, which is the 11 ms line in the chart above.
If steps 1 to 3 show backends waiting, read latency rising with load, and CPU headroom, you have a storage-bound database. If CPU is pinned instead, stop here and look at your queries. This check pairs well with the migration lock checklist when a slowdown started right after a schema change.
What should you try before moving to local NVMe?
Everything that keeps your durability model unchanged. The benchmark used the gp3 baseline, so it measures the cheapest configuration rather than the best EBS can do.
| Option | What it fixes | What it costs you |
|---|---|---|
| Provision more gp3 IOPS | Raises the I/O ceiling | Monthly bill, no operational change |
Add RAM and raise shared_buffers | Fewer page reads for hot data | Bigger instance |
| Fix bloat and add the missing index | Cuts pages touched per query | Engineering time |
| Partition or archive cold rows | Shrinks the working set | Schema and app changes |
| Local NVMe | Cuts random read and fsync latency | A new durability model, below |
Move to local NVMe when the first four are done and the working set still dwarfs RAM. Instacart and Datadog are cited in the talk as teams that run it for latency-sensitive workloads. If you are weighing the same trade-off against managed object storage, the S3 cost breakdown shows how to price the other side.
How to run Postgres on local NVMe without losing data
Make the cluster the source of truth, not the disk. Instance-store data is lost with its machine and cannot be snapshotted through the EBS API, so the usual “snapshot the volume” recovery plan does not exist here.
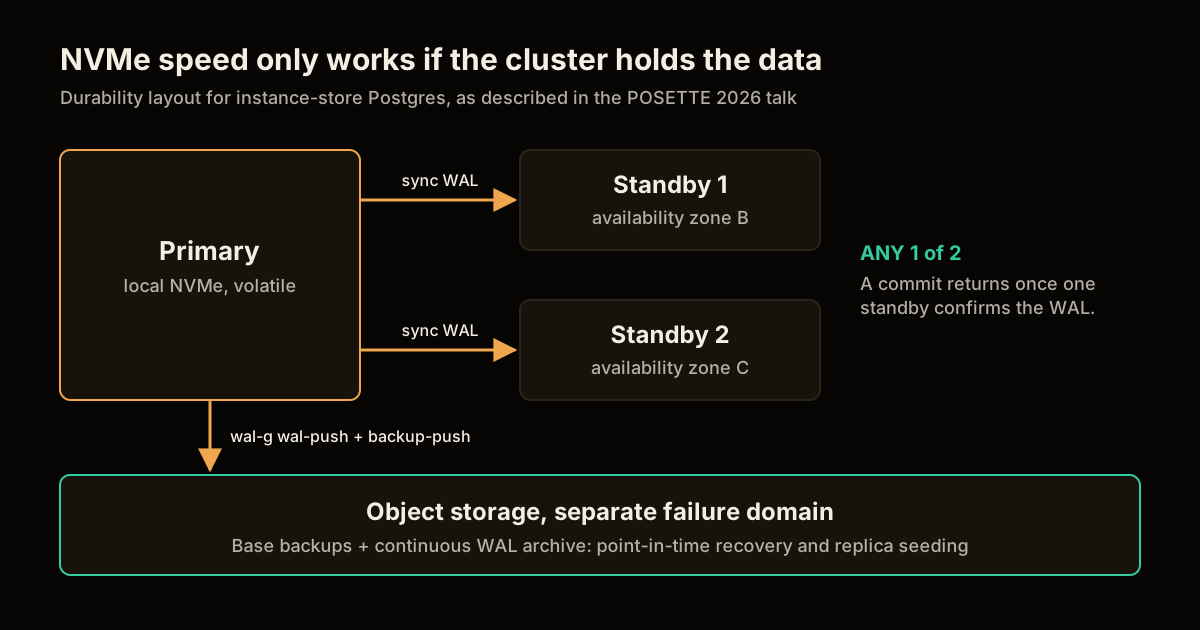
Require a standby to confirm every commit. Quorum synchronous replication with two standbys in different availability zones:
synchronous_commit = on
synchronous_standby_names = 'ANY 1 (standby1, standby2)'
One standby can fail without halting writes, and no acknowledged commit lives on only one machine. Read the synchronous replication docs for the behavior when both standbys are down.
Archive WAL continuously to object storage. WAL-G is the open-source tool the talk uses:
archive_mode = on
archive_command = 'wal-g wal-push %p'
archive_timeout = 60
Take scheduled base backups with
wal-g backup-push $PGDATAand keep both backups and WAL in a separate failure domain from the cluster.Rehearse two restores. A standby promotion for node loss, and a point-in-time restore from object storage for corruption or an operator mistake. Standbys handle fast failover; backups handle everything a standby faithfully replicates.
This is the real price of the speed. You now operate a replication topology and a backup pipeline that EBS used to hide. It is the same discipline as a zero-downtime migration: the design is easy, rehearsing the failure is the work.
What breaks if you trust this benchmark too much?
The headline is narrower than the title. The talk is called “Postgres Isn’t Slow. Your Storage Is.”, but the data supports a smaller claim: for a storage-bound, random-write workload, local NVMe removes most of the I/O penalty.
- One workload, one instance type, one EBS configuration. ClickHouse says a different EBS setup would likely change the result.
- A 482 GiB table over a 16 GiB cache is a deliberately hostile case. A working set that fits in RAM will see little difference.
- ClickHouse sells a Postgres-compatible managed service, so read the framing with that in mind. The numbers are still checkable with the four steps above.
- Treat any vendor-run benchmark as a hypothesis. The method in how to verify AI agent benchmark claims applies here unchanged: check internal consistency, then reproduce on your own data, as in a benchmark ratchet.
If you already run Postgres for queues, search and caching, as in use Postgres for everything, storage latency is the first limit you will hit, and this is the first thing to measure.
FAQ
How do I know if my Postgres storage is the bottleneck? Look for backends stuck in the IO:DataFileRead or WAL sync wait events while CPU stays low. Then confirm with track_io_timing, which gives you milliseconds per block read, and with pg_stat_io on Postgres 16 and later. If read latency climbs with load and CPU does not, the disk is the limit, not the query planner.
Is local NVMe really 9x faster than gp3 for Postgres? On one specific test, yes. ClickHouse’s benchmark ran random single-row UPDATEs on a 482 GiB table with a 16 GiB buffer cache, and local NVMe reached 16,030 TPS against 1,734 TPS on gp3 at 3,000 IOPS. That is 9.24x, but background work gained far less, so do not expect 9x on a cached or read-mostly workload.
Can I just raise gp3 IOPS instead of moving to NVMe? Often, yes, and you should try it first. The benchmark used the 3,000 IOPS gp3 baseline, so it measures the floor, not what a tuned volume can do. Provisioned IOPS, more RAM for shared_buffers, and fixing bloat are all cheaper than changing your durability model.
Is it safe to run production Postgres on instance-store NVMe? It is safe only if durability comes from the cluster instead of the disk. Instance-store data disappears with its machine, so you need synchronous replication to at least one standby in another availability zone, plus continuous WAL archiving and base backups to object storage. Test a restore before you trust it.
What does WAL-G do in this setup? WAL-G is an open-source tool that takes base backups and ships WAL segments continuously to object storage. That gives you point-in-time recovery inside your retention window and a way to seed new replicas. It covers corruption, operator error and whole-cluster loss, which a standby alone does not.
Sources
- Postgres isn’t slow, your storage is, ClickHouse blog recap of the POSETTE 2026 talk by Sai Srirampur: benchmark setup, results, latency breakdown, production architecture.
- PostgreSQL documentation: monitoring statistics,
pg_stat_io,pg_stat_databaseand wait events. - PostgreSQL documentation: synchronous replication, quorum commit with
ANY. - WAL-G, base backups and continuous WAL archiving.
Frequently asked questions
Google Search · Preferred sources
Prefer this site on Google
If you already read this writing, add umesh-malik.com as a Preferred Source. Google can then highlight it with a preferred badge in Top Stories, AI Overviews, and AI Mode — for you, not as a site-wide ranking boost.
Related Articles

Web Engineering
Traffic Anomaly or Outage? What a 30% Drop Actually Means
A 15-30% traffic anomaly or outage? Cloudflare's eclipse analysis shows the fix: five-minute buckets against a three-week matched baseline.

Web Engineering
Use Postgres for everything in production: 5 swaps, 1 cliff
Use Postgres for everything and four of the five swaps hold. The queue is the one that death-spirals: 383,000 dead tuples and 300ms locks at 800 jobs/sec.

Web Engineering
Zero downtime database migration: 5 flags and a 17x P90 gap
A zero downtime database migration is five feature-flagged phases, not a cutover. P95 said 4x slower, P90 said 17x, and the comparison code took a region down.
Keep reading
Get new posts on AI, Claude Code & LLMs
New deep-dives on AI engineering, Claude Code, and developer tooling — follow along however you prefer.
About the Author

Software engineer writing about AI, Claude Code, LLMs, OpenAI, Anthropic, and developer tooling. 5+ years building production systems at Expedia Group, Tekion, and BYJU'S.