Use Postgres for everything in production: 5 swaps, 1 cliff
Use Postgres for everything and four of the five swaps hold. The queue is the one that death-spirals: 383,000 dead tuples and 300ms locks at 800 jobs/sec.

TL;DR
You can use Postgres for everything — queue, cache, search, vectors, documents — and for most teams that is the correct call, because one consistency domain beats five systems you have to keep in sync. The catch is not throughput, it is MVCC: every swap pays the same hidden bill in dead tuples and vacuum pressure. The queue is where that bill arrives first — PlanetScale measured 383,000 dead tuples and 300ms+ lock acquisition at 800 jobs/sec before the queue went into a death spiral.
What is “use Postgres for everything”?
Use Postgres for everything is the practice of serving your queue, cache, search index, vector store and document store from features PostgreSQL already ships — SKIP LOCKED, UNLOGGED tables, tsvector, pgvector and JSONB — instead of running five separate systems alongside it.
The argument surfaced again this week in Raphael Bauer’s “PostgreSQL for Everything”, which walks through replacing Elasticsearch, MongoDB, Kafka, Redis, ClickHouse and a vector database with features Postgres already ships. It is a good list. It is also, like most versions of this argument, sold on the wrong benefit.
The pitch is usually fewer moving parts. That is real but secondary. The actual win is that every swap collapses a distributed-systems problem into a transaction. When your job queue is a table, enqueueing a job and writing the row that justifies it are the same commit — there is no window where one succeeded and the other did not. When your cache is a table, you cannot serve a value that was invalidated by a transaction that later rolled back. The dual-write problem, which is the thing that actually generates 3am pages, simply stops existing. If you have ever run a zero-downtime migration with dual writes, you already know how much machinery that removes.
That framing also tells you when the argument stops applying: the moment a component’s workload has nothing to do with your transactional data, the swap is buying you nothing and costing you contention.
The five swaps, and what each one costs
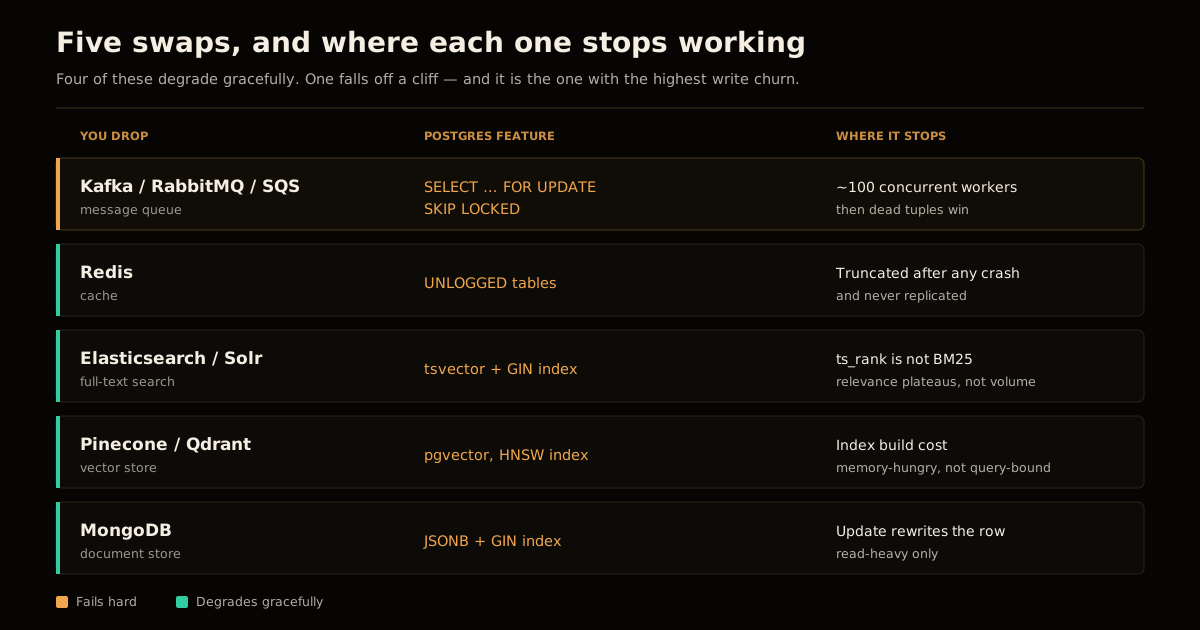
Here is the honest version of the table, with the failure mode attached to each row rather than left out of it.
| You drop | You use | Where it stops working |
|---|---|---|
| Kafka / RabbitMQ / SQS | SELECT ... FOR UPDATE SKIP LOCKED | ~100 concurrent workers on simple jobs |
| Redis | UNLOGGED tables | Truncated after any crash; not replicated |
| Elasticsearch / Solr | tsvector + GIN index | ts_rank is not BM25 — ranking quality plateaus |
| Pinecone / Qdrant | pgvector with HNSW | Index build is memory-hungry and blocking |
| MongoDB | JSONB + GIN index | Any update rewrites the whole document |
Two of those deserve a sentence each. UNLOGGED tables are fast precisely because they skip the write-ahead log, and the PostgreSQL documentation is blunt about the consequence: the table is automatically truncated after a crash or unclean shutdown. That is exactly the durability contract a cache wants and exactly the wrong one for anything else. And JSONB inherits Postgres’s row-versioning model, so updating one key in a 40KB document writes a new 40KB row — fine for read-heavy config, expensive for hot counters.
The vector swap is the one that has genuinely changed. pgvector with HNSW indexing is now a real answer rather than a compromise for most application-scale corpora, and if you are standing up retrieval from scratch, building the RAG pipeline on Postgres is the shortest path to something you can actually debug.
The queue is the swap that bites
Four of those five swaps degrade gracefully. Search gets less relevant. The cache gets colder. Vector recall drops a few points. You notice, you measure, you fix it.
The queue does not degrade gracefully. It falls over.
A job queue is the most hostile access pattern you can hand MVCC: every row is inserted, updated once or twice, and deleted within seconds, so the table is essentially pure churn. Each of those versions leaves a dead tuple behind, and the index keeps pointing at it until autovacuum catches up. Every dequeue then pays to traverse leaf entries that point at rows nobody can see, plus the I/O to visit a heap page and discard it.
PlanetScale re-ran the classic 2015 Postgres-queue benchmark on modern hardware, and the shape of the result is the thing worth internalising. With FOR UPDATE SKIP LOCKED and batched dequeues — the configuration everyone recommends — lock acquisition started at a healthy 1.3-3.0ms, spiked to 180ms at 24,000 dead tuples, and settled at 9-29ms once 42,450 dead tuples had accumulated. Throughput held around 50 jobs/sec. Nothing crashed. It just got roughly ten times slower while the dashboard said the queue was empty.
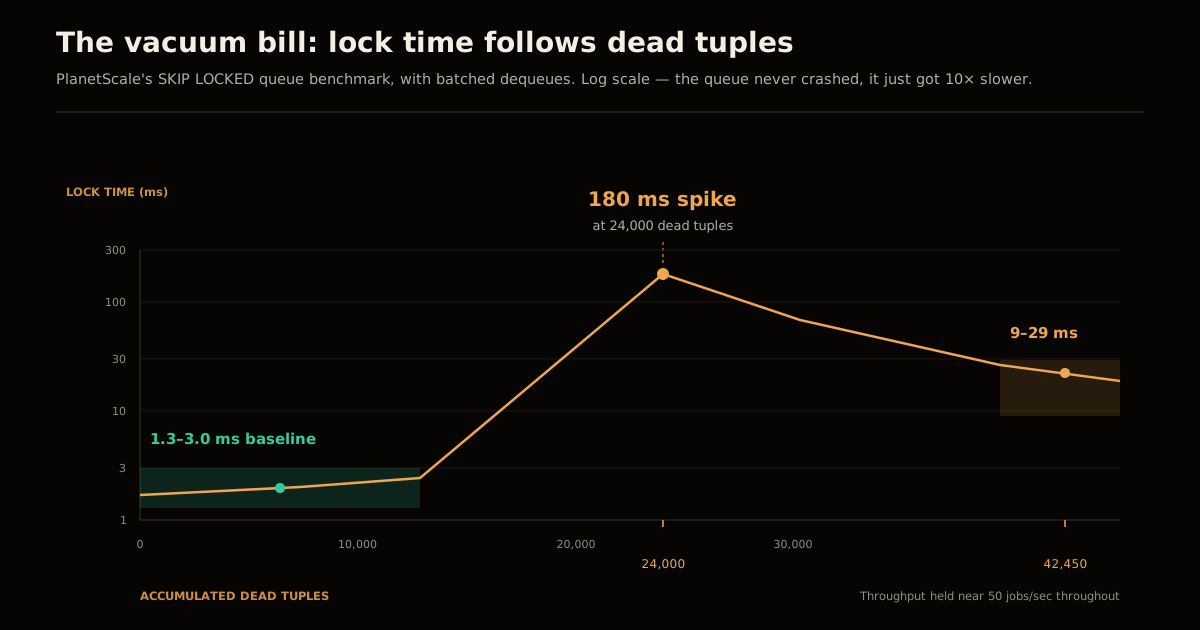
That is the vacuum bill, and it is charged to every swap on the list. The queue is simply the one with a high enough transaction rate to make it visible inside an afternoon.
Why a report can take down your queue
Here is the part that surprises people, because the cause and the symptom live in different parts of the system.
Autovacuum cannot remove a dead tuple that might still be visible to an open transaction. The oldest running transaction therefore sets a floor — the MVCC horizon — and nothing below it can be cleaned, no matter how much garbage has piled up. PlanetScale states the mechanism directly: a single transaction that takes two minutes to complete pins the horizon for the full two minutes. Three 40-second analytics queries staggered 20 seconds apart pin it continuously.
So the failure chain is: someone ships a dashboard query → the horizon stops advancing → autovacuum runs on schedule and accomplishes nothing → dead tuples accumulate linearly → dequeue lock time climbs → workers fall behind → the backlog grows → more churn → more dead tuples. That is the death spiral, and the original 2015 test hit it within 15 minutes.
PlanetScale’s high-stress run at 800 jobs/sec makes the two outcomes stark. Without concurrency control on the competing analytics queries: a 155,000-job backlog, lock times past 300ms, 383,000 dead tuples. With those queries limited to one at a time: zero backlog, 2ms lock times, and dead tuples cycling between 0 and 23,000 instead of climbing.
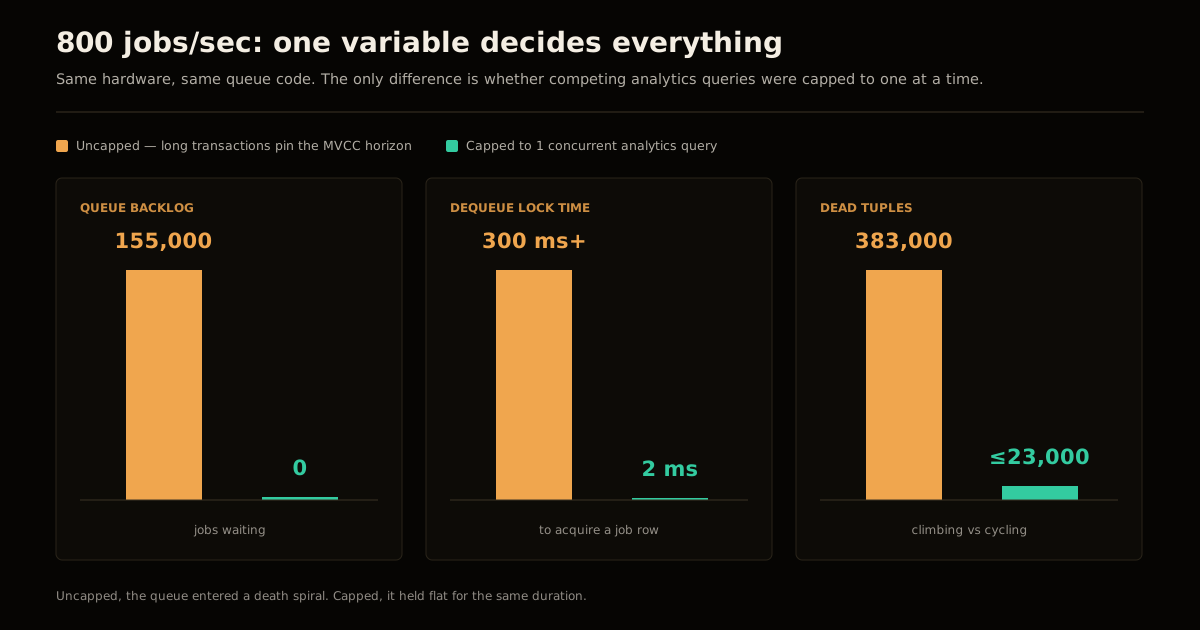
Same hardware. Same queue code. The variable was whether an unrelated report was allowed to hold a transaction open.
Where each swap actually stops working
Thresholds, so you can decide before you are debugging at 3am rather than after:
- Queue — the practical ceiling is around 100 concurrent workers on simple jobs. Beyond that you are tuning autovacuum per-table, batching dequeues, and rate-limiting unrelated queries, which is a real engineering budget. Queue tables also bloat disproportionately: tens of gigabytes of table for a few megabytes of live rows is a normal outcome, not a pathology.
- Cache — the limit is durability semantics, not scale. If losing the whole table on an unclean restart is survivable,
UNLOGGEDis genuinely competitive with Redis. If it isn’t, you don’t want a cache. - Search — the limit is relevance, not volume. Millions of rows are fine; BM25-grade ranking is not available in core.
- Vectors — the limit is index build cost and memory, not query latency.
- Documents — the limit is update frequency. Read-heavy JSONB is excellent; hot-path JSONB updates are write amplification with extra steps.
What I would actually do
Start with everything in Postgres. That is not a compromise position; it is the correct default, for the same reason a $166/month Swarm cluster beats Kubernetes for most teams — the simpler thing is not merely cheaper, it is the one you will still understand under pressure.
Then buy three pieces of insurance on day one, because all three are cheap now and expensive later:
- Tune autovacuum per-table on the queue. The queue’s churn rate has nothing in common with your
userstable, and the global defaultautovacuum_naptimeof one minute is far too slow for it. - Cap concurrency on long-running queries against the same database. This single control is what separated the death spiral from the flat line in the benchmark above.
- Watch dead tuples, not throughput. Queue depth looks perfect right up until it doesn’t.
n_dead_tupinpg_stat_user_tablesis the leading indicator; latency is the lagging one — the same baseline-before-alert discipline that separates a real anomaly from noise.
Move a component out only when you have a measurement saying you must — and when you do, move the queue first. It is the one whose failure mode is a cliff.
The takeaway
“Use Postgres for everything” is right, and the usual argument for it is wrong. You are not mainly saving on operational overhead; you are eliminating dual writes, which is a correctness win rather than a convenience one. The price is that five workloads with wildly different access patterns now share one MVCC horizon, and the highest-churn workload on that horizon — almost always the queue — is the one that will show you the bill. Instrument dead tuples, cap your long transactions, and the swap holds for far longer than the sceptics claim.
FAQ
Should I use Postgres as a message queue instead of Kafka or SQS? For most workloads, yes — start there. A queue built on SELECT ... FOR UPDATE SKIP LOCKED is roughly twenty lines of SQL, it participates in the same transaction as your business writes, and it removes an entire class of dual-write bug. The honest ceiling is around 100 concurrent workers on simple jobs.
Can UNLOGGED tables really replace Redis? For cache semantics, largely yes. They skip the write-ahead log, which is where most of Postgres’s write cost lives. The caveat is in the documentation: an unlogged table is automatically truncated after a crash or unclean shutdown, and it is not replicated to standbys.
Is Postgres full-text search good enough to drop Elasticsearch? For site search, admin search and most in-app search over a few million rows, yes. What you do not get in core Postgres is BM25 relevance — ts_rank is a simpler frequency-based score — so if ranking quality is the product, that is where a dedicated engine wins.
Why do dead tuples matter so much for a Postgres queue? A queue is the worst possible access pattern for MVCC: insert, update, delete, all within seconds, so the table is almost entirely churn. PlanetScale’s benchmark shows lock acquisition climbing from a 1.3-3.0ms baseline to a 180ms spike at 24,000 dead tuples.
What is MVCC horizon pinning? Autovacuum cannot remove a tuple that might still be visible to an open transaction, so the oldest running transaction sets a floor below which nothing gets cleaned. A single two-minute transaction pins the horizon for the full two minutes — which is how an unrelated analytics query degrades your queue.
Sources
- Raphael Bauer, PostgreSQL for Everything
- PlanetScale, Keeping a Postgres queue healthy
- PostgreSQL documentation,
CREATE TABLE— UNLOGGED andSELECT— locking clauses
Frequently asked questions
Google Search · Preferred sources
Prefer this site on Google
If you already read this writing, add umesh-malik.com as a Preferred Source. Google can then highlight it with a preferred badge in Top Stories, AI Overviews, and AI Mode — for you, not as a site-wide ranking boost.
Related Articles

Web Engineering
Streaming HTML Out of Order Without JavaScript (2026)
Streaming HTML out of order without JavaScript: how Declarative Partial Updates and Declarative Shadow DOM reorder content natively in Chrome 148.

Web Engineering
Is Your Postgres Migration Safe? Catch the Table Lock First
Is your Postgres migration safe? Not if it takes ACCESS EXCLUSIVE on a hot table. The lock table and 5-step check that catches it before you run it.

Web Engineering
Fix Performance Regressions With a Benchmark Ratchet (3.1x, 0 Breaks)
Fix performance regressions with a benchmark ratchet that fails CI on regression and locks in wins. How Claude shipped 3,000 changes at 3.1x, zero breaks.
Keep reading
Get new posts on AI, Claude Code & LLMs
New deep-dives on AI engineering, Claude Code, and developer tooling — follow along however you prefer.
About the Author

Software engineer writing about AI, Claude Code, LLMs, OpenAI, Anthropic, and developer tooling. 5+ years building production systems at Expedia Group, Tekion, and BYJU'S.